Difference
The Difference expression shortcut calculates the difference between two nodes. The nodes should be on the same level in the hierarchy, and you can specify how many steps there should be between the nodes to be compared.
Example
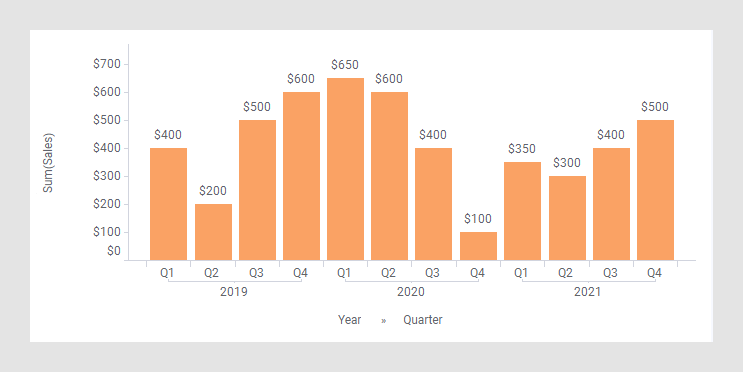
As starting point, the bar chart below is used. It shows the quarterly sums of sales for three years.
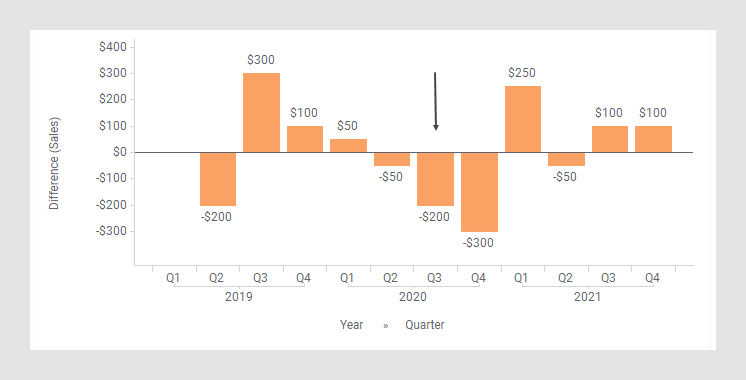
In the next bar chart, the shortcut expression Difference has been applied on the Value axis. (The arrow points to a bar used to explain what is calculated in the expression further down.)
The following expression is used on the Value axis.
Sum([Sales]) THEN [Value]- First([Value]) OVER
			 (NavigatePeriod([Axis.X],0,-1))
The first part of the expression specifies that the column [Sales] should be aggregated as a sum. The result of this part goes into the [Value] column to be used in the expression following THEN.
In this latter part of the expression, each node gets subtracted by its preceding node (because the number of steps is set to -1). See NavigatePeriod() for details.
The aggregation First() is just used because an aggregation is required before the OVER keyword. It will take you to the first value of the node to subtract, but since each node only has one value, this corresponds to picking the value of the node.
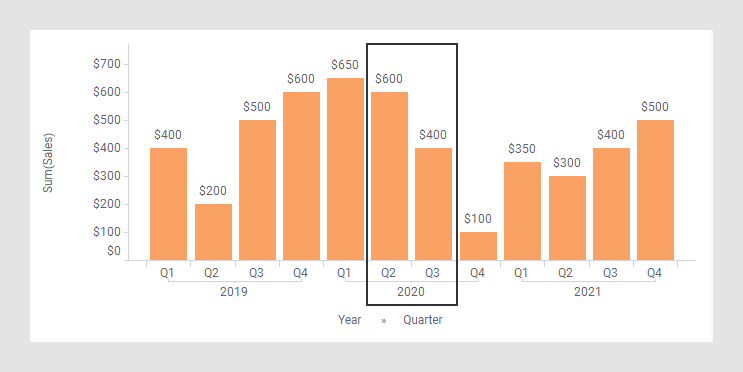
For example, calculation of the Difference for Q3, 2020 (see the arrow in the previous image):
-$200=$400 - $600
(the difference of the node and its previous node, see the rectangle).
The column selector in expanded mode
In the installed client, the extended column selector offers controls that make it easy to change various parameters in the expression shortcut:
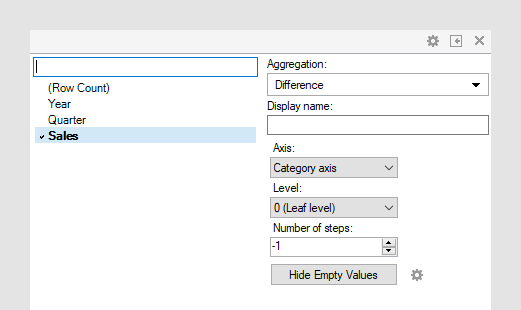
| Display name | Optionally, specify a different display name instead of the default "Difference ([Column Name])". |
| Axis | Specify the axis over which to calculate
the nodes.
Only categorical axes that perform some kind of grouping can show up in the drop-down list. This means that if you only have a grouping on the X-axis, then this is the only axis available, whereas if you also have colored by a categorical column then the Color axis will be available as well, and so on. |
| Level | Define the hierarchy level to compare
values at. You can either specify a named level such as "Year", "Quarter" or
"Month", or you can set a number, which moves you up or down in the currently
set hierarchy on the selected axis.
If the level is 0, you will always compare the current leaf level, even if you change it in the visualization, for example, using a hierarchy slider. If the level is set to "Year", then you are in fact doing a Difference Year over Year calculation, and the aggregation selector will change correspondingly. |
| Number of steps | Define the number of steps between the nodes to compare. If the number of steps is -1, then the difference will be calculated between the current node and the one before it. If the number of steps is 1, then the difference will be calculated for the current node and the one following it. |
| Hide Empty Values | Creates a
Show/Hide rule that hides all empty values. Click the
properties symbol
|