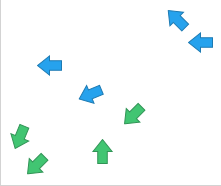
Some marker shapes, for example arrows, indicate directions. If
you in a scatter plot rotate such markers, you can visualize directions of
motions. What you need is a column that contains values that can be interpreted
as degrees.
About this task
The rotation of the markers can be made clockwise or
counter-clockwise. A full rotation is 360 degrees, and a value of 361 is
interpreted as 1 degree.
Procedure
-
Right-click the scatter plot, and select
Properties in the opened menu.
The
Properties popover is displayed.
-
In the popover, select
Shape.
The
Shape section is displayed.
-
Select
Fixed shape, and in the shape palette, click a
marker suitable for showing direction.
-
In the popover, select
Rotation.
The
Rotation section is displayed.
-
Select the column and, if applicable,
which
type of aggregated value to use for defining how many degrees the
markers should be rotated.
-
Select rotation direction;
Clockwise or
Counter-clockwise.
Results
The markers in the
scatter plot are rotated to indicate different directions.