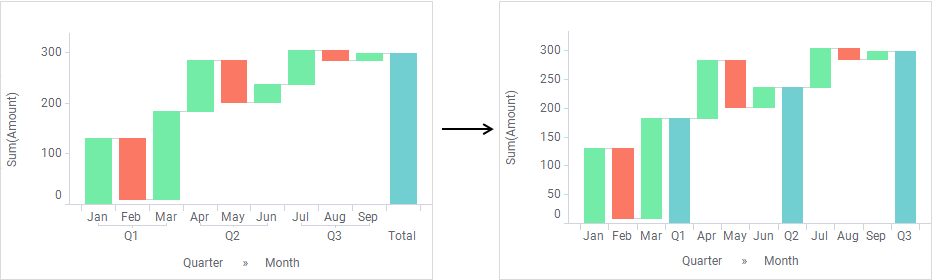
In the waterfall chart, bars that show intermediate running totals
can be shown. They can be displayed in waterfall charts where a categorical
coloring is applied, and in waterfall charts with a hierarchy on the category
axis.
About this task
Before you begin
A hierarchy must be
specified on the category axis, or a categorical coloring must be applied on
the color axis.
Procedure
-
Right-click the waterfall chart, and select
Properties in the opened menu.
The
Properties pop-over is shown.
-
Click
Total bars.
The
Total bars
section is shown.
-
Make sure the
Show total bars check box is selected.
Tip: You
can use the color palette to specify the color of the intermediate total bars.
-
Select the
One total bar per value in radio button.
-
In the drop-down menu, select the column containing the values
after which you want to display totals.
Results
The intermediate total
bars are shown.
Note: Adding intermediate
total bars to a hierarchically structured waterfall chart displays the category
axis scale labels in a flat structure as shown in the upper-right waterfall
chart.