Make calculations on the data
There are many ways to make calculations on the data.
Aggregations and expressions
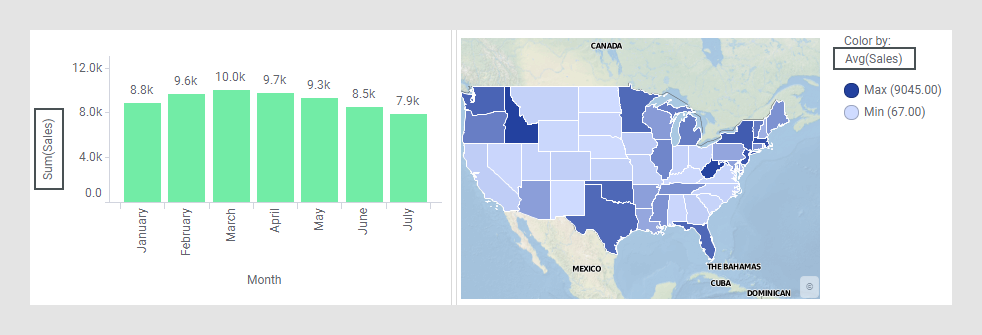
The most typical calculations that are made in the visualizations are the aggregations (for example, sum, average, max, and median), which you specify on the various visualization axes to summarize the data:
However, calculations on the data can be done in other ways and at different places in an analysis to get more out of your data.
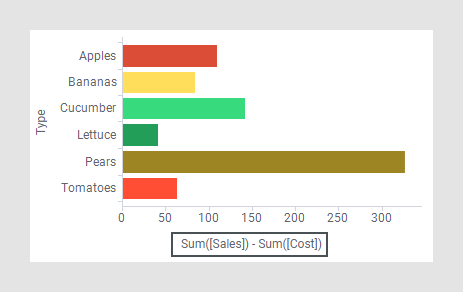
First of all, if any of the predefined aggregations does not match the calculation you want to do, you can create your own expressions to apply on the various axes in a visualization as exemplified below.
Moreover, you can create expressions whose resulting values are added as a new column in a data table.
Expressions, predefined as well as new expressions, can be applied not only on the ordinary axes that are used for setting up a visualization. You can also use them, for example, to add error bars or to create subsets.
Statistical tools
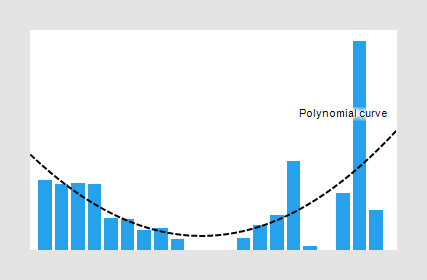
When using the installed client to create analyses, there are many built-in tools for performing powerful computational and statistic analytics. Curve fit models, methods for examining data relationships, data clustering methods, ranking of line similarities, or making predictions are all built-in tools.
The images below illustrate a couple of examples.
Curve fit
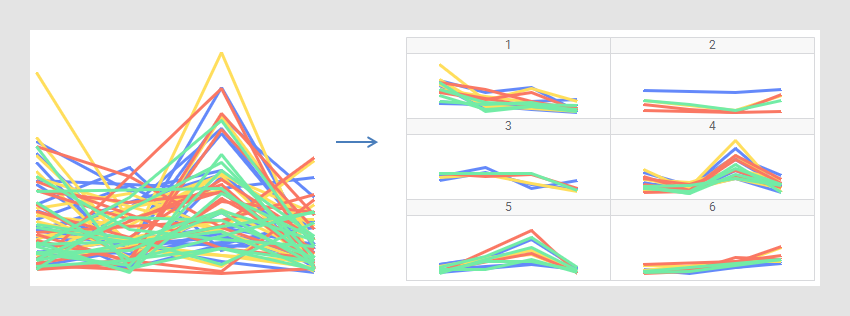
K-means clustering
Data functions and scripts
The use of data functions is a way of adding even more statistical capabilities to an analysis. Data functions are calculations based on scripts from R scripts running under TIBCO Enterprise Runtime for R (TERR) for Spotfire, open source R, Python, SAS®, MATLAB®, or other solutions. Which of these options are available depend on your specific Spotfire environment. The data functions are defined using the installed client but they can be used and run from within various parts of Spotfire in all clients.
Using the installed client, you can also define IronPython scripts, JavaScripts, or scripts written in custom query languages, to perform actions in your analysis. The scripts have access to the Spotfire API.
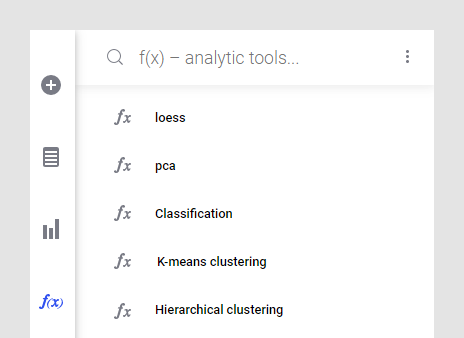
The f(x) flyout
The f(x) flyout is a place where it is possible to pin data functions saved in the library, for easy access to calculations and tools when creating analyses. In the installed client, you can also find analytic tools such as K-means clustering here.