Editing matches to transform values with different casing
Perhaps you have two data tables which both contain a string column named 'Product', but in one data table, the values are written in lowercase ('apples'), while in the other data table they are written with the first letter in uppercase ('Apples'). Because the columns have the same name and data type they will be matched automatically. However, to be able to combine data from these columns in one visualization, the values in one column must be transformed so that they are written in the same way in both columns.
About this task
By adding a transformation step to the column match rather than converting the actual column values you can use the original value names in the visualization.
Before you begin
Procedure
-
In the
Edit Match dialog, make sure the columns named
'Product' are selected in the
Left matching column and
Right matching column selectors.
The Sample value under the left and right matching column shows the first value in the selected column (provided it is not in-db data).
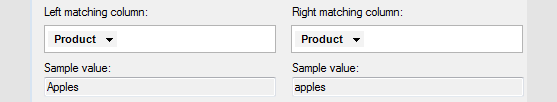
What you select here is what will be seen on the axes in a visualization. -
Select
Lower.
In the Sample value fields you can now see that the values are written as 'apples' in both columns.
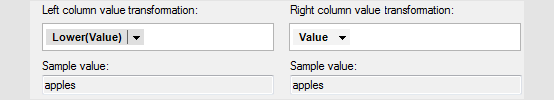
The transformations are transparent to what is shown in the visualizations, which means that even if you apply the transformation Lower(Value) you will not have to see this in the visualizations, but can use 'Apples' with a capital A on the axes.
Results
The transformation step is always done in-memory, independent of the original source of the data, which makes it possible to perform changes that the original data source does not support. For example, some in-database sources do not allow you to switch data type of a column, but because the transformation step is done in-memory you can create matches with in-database data of different data types this way. It is also useful for in-database data where there are no row methods in the system (for example, OLAP cubes).
However, there are also cases when you must apply methods on the
columns directly, rather than using a transformation, for example, when the
grouping of values is affected by the result from the method applied. For cube
data you might also want to specify that the match should be done by keys
rather than by values and this is done by selecting the
KeyOf method on the matching column of the cube
directly.