Filtering schemes
One of the main strengths of Spotfire is the ability it gives you to filter your data, that is, to control which data should be visible and used in calculations. This means that you can easily show or hide data for specific categories, change the time range to look at, step through a sequence of values one at a time, and so on. Filtering usually affects all pages and visualizations, but you can also define different filtering schemes to be used by different pages or visualizations.
As an author with the Advanced Filter Panel Properties license feature enabled, you have the possibility to add your own filtering schemes, which can be applied to the analysis per page or per visualization. This gives you the complete freedom to control which pages and visualizations will affect each other.
You can configure the filtering schemes to work on any combination of visualizations and/or pages in your analysis. For example, you can keep all the visualizations on all the pages related by using the same filtering scheme for all of them, or, you can choose to specify different filtering schemes for all the visualizations in an analysis, or any combination in between these two extremes. See Limiting What is Shown in Visualizations in the Spotfire Analyst User Guide to learn how to configure a visualization to use a different filtering scheme than the filtering scheme used on the page.
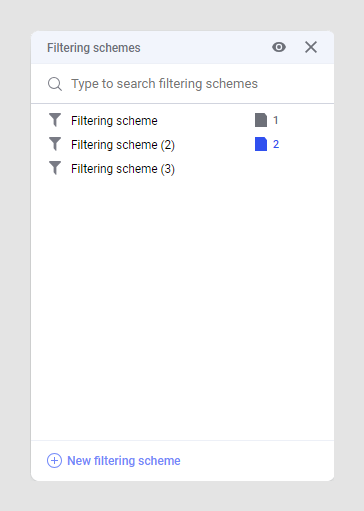
In the Filtering schemes panel (), you can see on which page, or in which visualization, a certain filtering scheme is used.