Finding your location on a map using the Spotfire app
You can add a marker showing the current latitude and longitude in a map visualization, identifying where iOS mobile app users are currently located when they tap the location icon in the app.
Before you begin
About this task
Adding expressions to find your location
To show a marker with your current location, you must first create a new data table, containing three calculated columns based on the location properties.
Procedure
Results
Adding a marker to show your current location
When you have created the data table containing your current location as described above, you can add this data table as a marker layer in a map chart visualization.
Before you begin
Procedure
Results
isLocationSet is
True, the marker of the specified shape and color is
shown on the map at the current latitude and longitude.
This example shows bike rental stations in the Swedish city
Gothenburg. The text area at the top shows the current location as Latitude and
Longitude. The column
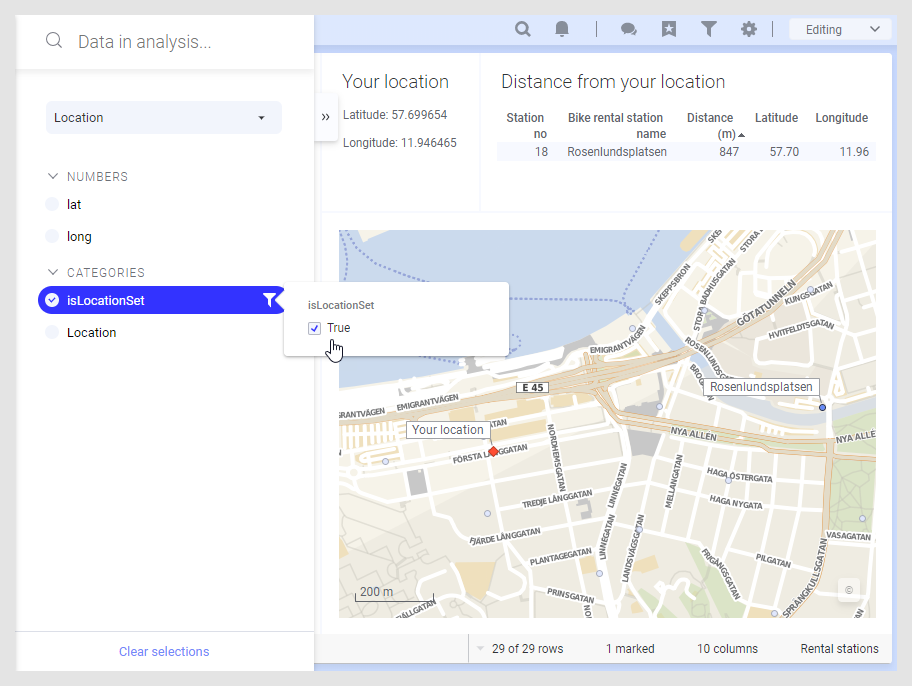
isLocationSet is set to
True, which means that the Location marker layer
displays a red marker at the current latitude and longitude.