Data tables with matching columns using different names
If you want to show data from multiple data tables in a single visualization, the data tables must have at least one column match available. This example shows how you can add a manual column match when columns to match exist but they have different names.
About this task
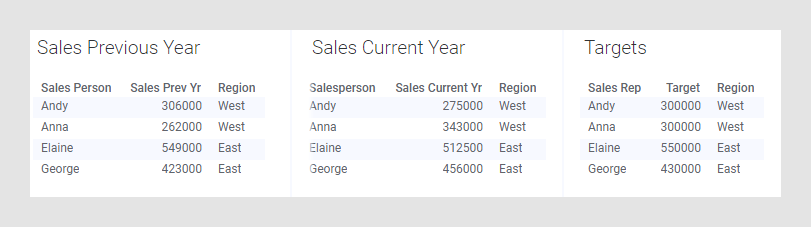
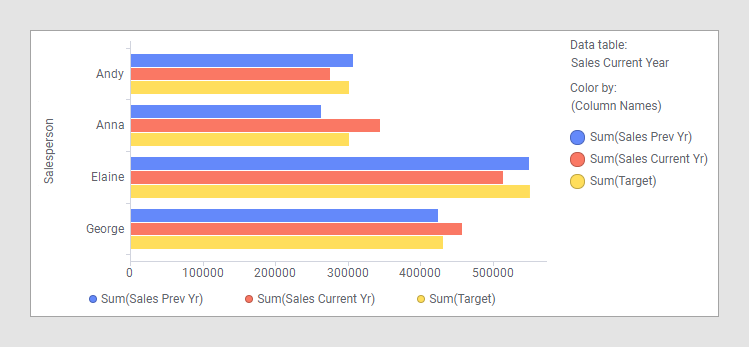
However, if you want to compare the performance of the four salespersons rather than sales per region, you must use a column containing the names of the persons on an axis that groups the visualization in some way; for instance, on the category axis of a bar chart. In this example, those columns are named 'Sales Person', 'Salesperson', and 'Sales Rep' respectively, which means they are not identical and have not been matched automatically. But the columns contain the same values, so they can be used to group an axis in the visualization. To do so, the column matches must be added manually.
To use the data table named 'Sales Current Year' as the main data table, and to include data from the other two data tables in the same visualization, you must add two matches: 'Salesperson' - 'Sales Person' and 'Salesperson' - 'Sales Rep'. As long as you use 'Sales Current Year' as the main data table, it is not necessary to add a match between 'Sales Person' and 'Sales Rep', but you can add a match between them as well.
Before you begin
Procedure
Results
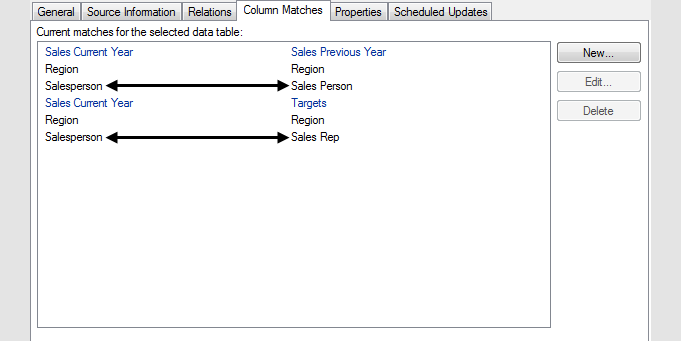
Note that column matches for the column named 'Region' had already been added automatically.
With the added matches, you can now create a visualization where 'Sales Current Year' is the main data table, and the column 'Salesperson' is used on a grouping axis: