Cross table
A cross table is a two-way table consisting of columns and rows. It is also known as a pivot table or a multi-dimensional table.
It is a grid of cells defined by a Vertical axis and a Horizontal axis. On these axes, data columns are specified to organize the data.
Its greatest strength is its ability to structure, summarize and display large amounts of data. You can also use the cross table to determine whether there is a relation between the row variable and the column variable.

The actual contents of the table cells are aggregated values, for example, sums or averages of the data, defined by the intersection of the two axes. What data you want to aggregate is selected in another axis, the Cell values axis.
You can change the appearance of the cross table. For example, headers can be displayed horizontally or vertically, and the horizontal as well as the vertical alignment of the header texts can be specified.
Example
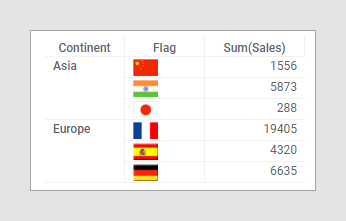
Below is a cross table showing the sum of sales for different types of fruits and vegetables.

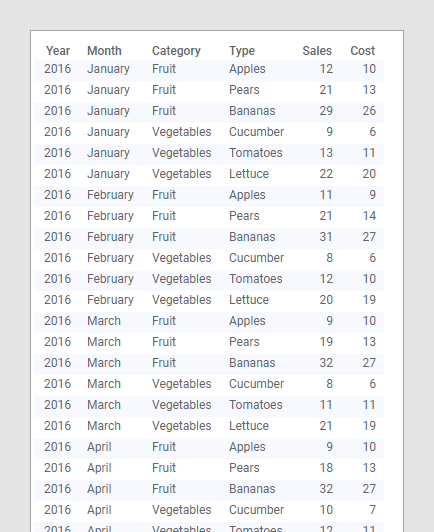
The same data displayed in a regular table takes up far more space and it is much more difficult to get an overview:
Totals
You can display grand totals for columns and rows (the example above shows grand totals for columns as well as rows). It is also possible to display column subtotals, if the vertical axis is hierarchically structured.
Images in the cross table
Cross tables can also be configured to show images in axis labels, provided that one of the following is fulfilled:
- Images are acquired via an URL, built up by the content of the selected expression/column. The actual image may then reside in a file on the network, or on the Internet, and is rendered using the Image from URL option in the Label Rendering dialog.
- Images are stored in BLOB columns in an in-memory data table and rendered directly as images.
- A virtual column producer is available which can transform the value from the chosen expression/column into a desired output. For example, a column containing the IDs of molecules can be used on the axis and the corresponding Molfiles can be fetched from a database and rendered as images showing chemical structures in Spotfire.