NavigatePeriod()
Some node navigation methods are especially suited for hierarchies containing periodic data, first and foremost time hierarchies. Time is structured hierarchically by nature (like year, quarter, month), and the time periods are recurrent. One of these navigation methods is NavigatePeriod(). This method lets you define your own navigation in a hierarchy, because you can specify four arguments, that is, input values that control which axis to reference, how many levels to move up in the hierarchy, how many steps to move sideways, and how many levels to move down.
As a matter of fact, the NavigatePeriod() method can replace many of the other navigation methods. See Comparing the NavigatePeriod() and Parent() methods.
Moreover, because the nodes in a time hierarchy are obvious, any nodes that miss data can be detected automatically.
The NavigatePeriod() method is exemplified below.
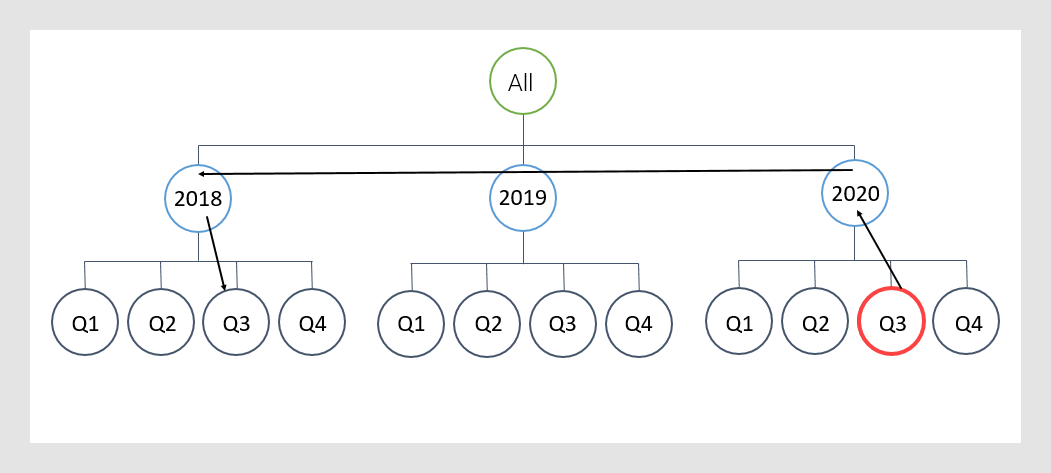
This example uses Q3, 2020 as the starting node. Assume you want to reference Q3, 2018. Then you can define a NavigatePeriod() expression with three arguments:
NavigatePeriod([Axis.X],"Year",-2)
NavigatePeriod([Axis.X],1,-2) would have given the same
result as
NavigatePeriod([Axis.X],"Year",-2).
Example
The bar chart shows sales figures in January and February for different types of fruits and vegetables, split also by their category. Assume you wish to display, expressed in percentage, each type's monthly contribution to the sales.
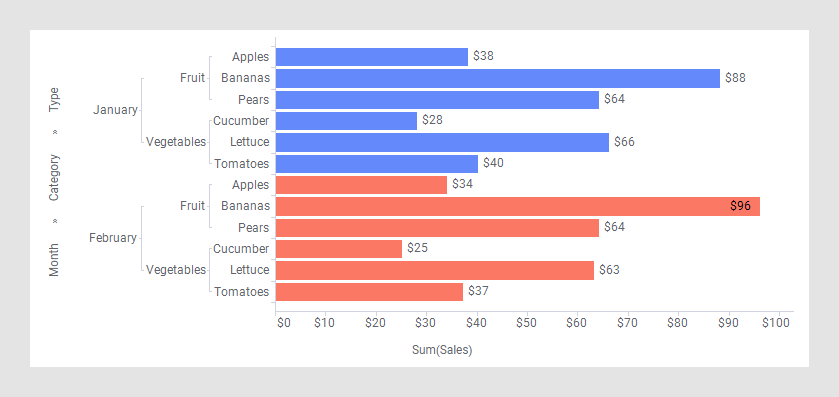
The Parent() method would work fine to return a type's contribution within the fruit and vegetables categories respectively, that is, one level up in the hierarchy, but it would not work that easily moving two steps up!
In this case the NavigatePeriod() method is a good choice. See the expression on the value axis below:
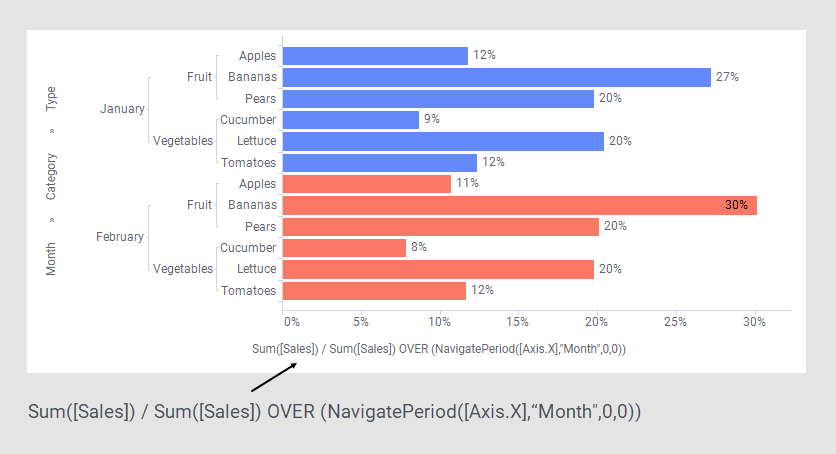
- The first argument, [Axis.X], refers to the hierarchy axis, in this case the Category axis. Note that the Category axis is always referred to as Axis.X, no matter if the orientation of the bar chart is horizontal or vertical.
- The second argument, "Month", navigates up to the Month level, that is, two steps up in the hierarchy. "Month" could just as well be replaced by 2 in the expression.
- The third argument, 0, specifies that no navigation takes place sideways in the hierarchy.
- The fourth argument, another 0, keeps the Month level.