Parallel coordinate plot
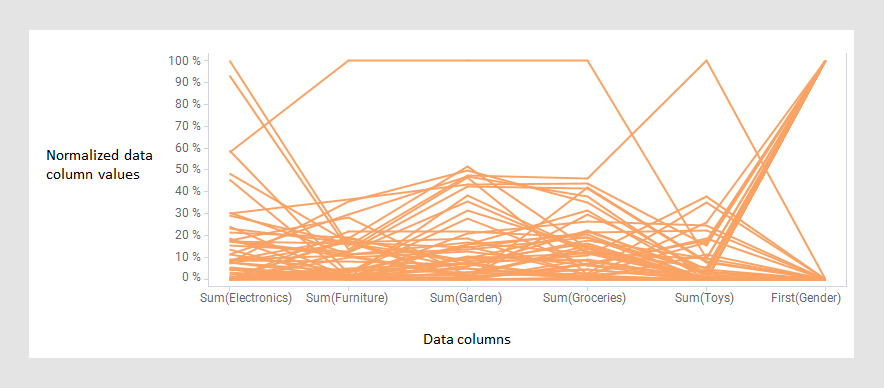
A parallel coordinate plot is used to compare data values which are of completely different types or magnitudes within a single visualization. The values are normalized and then presented as points on a line, or a profile, with one point per data column. This makes parallel coordinate plots similar in appearance to line charts, but the way data is translated into a plot is very different. The visualization is useful also for examining patterns.

The values can represent aggregated data or non-aggregated data for the particular data point. An aggregated value could be, for example, a sum, an average or the first value in a data column.
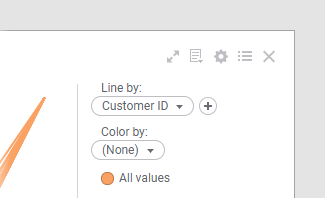
Important axes are the Line by axis and the Color by axis. These axes are used to select the columns whose values you want to represent as lines and you can modify them from the legend.


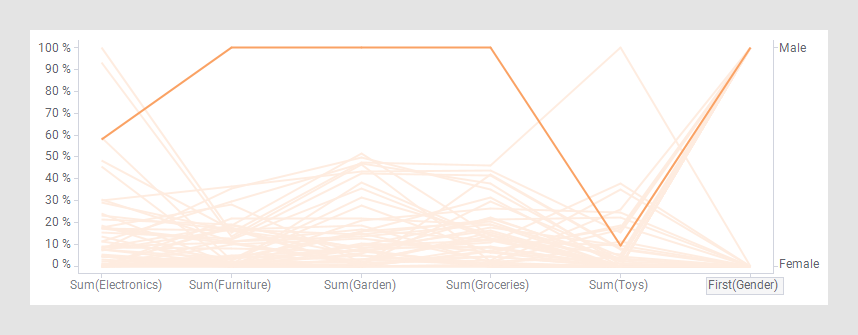
Categorical column values are also possible to visualize. Note the gender column furthest to the right where male and female customers are split into different values on the percentage scale.
You can change some settings directly from the visualization by clicking on selectors or on the axes, but to change things like labels, tooltips or gridlines, you use the visualization properties.
On the Appearance page of the visualization properties, you can specify the Line width, Transparency, and whether to break lines when an empty value is found in the data used to create the line.
All visualizations can be configured to show data limited by one or more markings in other visualizations only (details visualizations). Parallel coordinate plots can also be limited by one or more filterings. Another alternative is to configure a parallel coordinate plot without any filtering at all. See Adding data limitations for a visualization for more information.
You can show data from multiple data tables in the same visualization if a proper data table matching is available. For more information, see Multiple data tables in one visualization and Column matches.
- Creating a parallel coordinate plot
The parallel coordinate plot is used to compare data values of different types or magnitudes. All values are presented as points on a line, or profile, with one point per data column. Items that are similar to each other often show a similar profile. - Displaying actual values in the parallel coordinate plot
In the parallel coordinate plot, the values are normalized and expressed as a percentage. The percentage scale is shown to the left in the visualization. However, it is possible to also show a scale for the actual values. The scale can be displayed to the right in the visualization for one column at a time.