Related data tables, joins and column matches
Depending on how you access your data and which client you use, there are several different ways to link data from different sources together using Spotfire. With in-memory data, you can add new data as columns or rows to an existing data table. If you use data from data connections, you might be able to create a structural relation already on the database side, when creating the data connection. If you choose to keep your data as separate data tables in Spotfire, you can either create a relation between the data tables to support brush-linking, or, simply use columns from different data tables directly in a visualization, if they have at least one column match.
The different ways of bringing data together into Spotfire provide various degrees of tightly coupled data.
Add columns or rows to a data table
In some cases, when you need to bring in-memory data from different data sources together in a single visualization, it might be more suitable to add columns or add rows to a data table, rather than keeping two different data tables.
If Spotfire identifies that new in-memory data seems to fit in an already available data table, you might get a recommendation to add the data as new rows. See Adding more data for more information. However, you can always ignore the recommendation. You can also choose to add new data, as new rows or as new columns, to a specific location in the data table structure from the data canvas.
When you add data as new columns, you can choose which type of join to use in the Add columns – match columns dialog, and use the interactive example in the dialog to see the difference between the join types.
Structural relations between database tables in connections
With in-database or in-memory data tables accessed using a data connection, you can often join several database tables into a single virtual data table before adding it to Spotfire using key columns (primary/foreign keys).
When you set up data connections from relational or other non-cube data sources, you have the possibility to use relations created by the database administrator or add new relations between original database tables in one data connection, so that they in Spotfire are joined to a single view (or data table). See Details on Views in Connection in the Spotfire Analyst help for more information.
Joins in information links
If data is fetched through information links (can be defined using the installed client only), it is possible to define joins between different database tables using Information Designer.
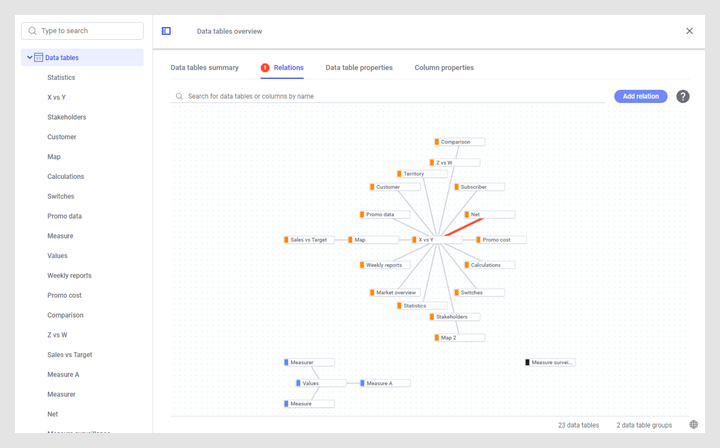
Relations between data tables
You can create relations between different data tables in Spotfire without actually joining them. This will form a looser connection between the tables but it can be used if you want to set up a details visualization using one of the data tables, to be limited by selections in the other, or just to provide brush-linking, meaning that you can mark or filter items in a visualization based on one data table and automatically get the same items marked or filtered in a visualization based on the related data table. When data tables are related, marking is always carried over, but filtering can be configured in different ways. See Filtering in related data tables for more information.
For a relation to be useful, you must have one or more key columns (identifier columns) available in both data tables, and use these to define which rows in the first data table will correspond to rows in the second data table. The matching can also be configured using expressions that combine multiple columns, or modify the values in the columns. If you need more than one key column to define a unique identifier, you can add one column pair for each identifier column.
You can also add some simple relations using the Link data tables recommendation, which can show up if you select a suitable ID column for one of your data tables in the Data in analysis flyout.
Column matches
You can often combine data from different data tables in one visualization without having a relation between them, if at least one column is available in both data tables. If two columns are of the same data type and have the same name, Spotfire will match them automatically during loading.
Column matches is the only option to use when you want to visualize data from two separate in-database sources, which cannot be joined in other ways. However, you can also use column matches, for example, if you have a too large data volume to be able to join sources directly, but when visualizing the data you only use aggregated values for the columns you match on.
In the installed client, you can view, create and edit column matches in the Data table properties dialog. Click and go to the Column matches tab to define column matches.
Using a different data table to show a line
You can show a simple line from a different data table in a scatter plot. See Details on Line from Data Table in the Spotfire Analyst help.