This is Spotfire
Do you want to do ad-hoc analytics, perform in-depth exploration of data, or create informative, up-to-date dashboards? Then Spotfire® is the tool. In this guide, you learn what Spotfire is, and how to get the most out of it. You will find what you can do to gain insights about your data, and how to do it in detail, all supplemented with examples that serve as a source of inspiration.
![Spotfire UI](../../images/intronux.png)
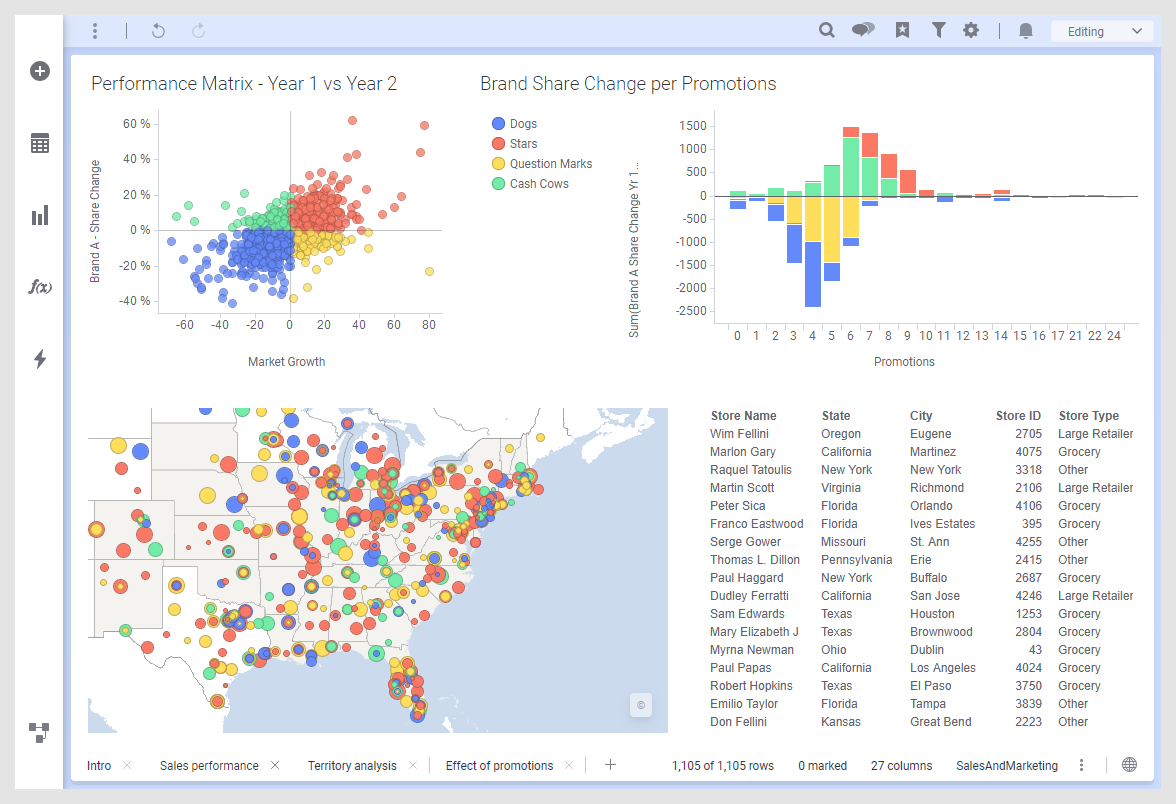
Read on to understand how to get the data into an analysis, and how you can visualize and interact with the data to answer the questions you might have. Interactions can involve anything from filtering to data of interest, drilling down to more detailed levels, performing calculations on the data, or applying statistical methods.
The Spotfire user interface assists you in analyzing the data by providing recommendations on visualizations that fit the data you want to display. You can also get assistance in discovering relationships in the data, or how to add new data in good ways. Recommendations and tips are indicated using a light bulb icon.
Your findings can be shared with others in different ways, and you have a lot of options to customize the visual appearance of an analysis.
In addition, you learn how to know the details of your data, and how to keep track of the data history from the initial loading to the current content after modifying and cleansing it.
Get started
- The user interface
The most vital parts of the user interface are shown below. - Load data
The most important thing when working with Spotfire is your data. All data is accessed by clicking Files and data on the authoring bar. - Visualize data
To represent the data visually, many different types of visualizations are provided, all with different strengths for displaying the data in an informative way. - Analyze data
Often, the visualizations you add using the Data in analysis flyout provide enough knowledge of your data, and no further exploration is needed. But, after you have added the visualizations to your analysis, there is a wide range of possibilities to extend the analytics, no matter which method you used for creating them. - Share with others
Analyses can serve different purposes. Some might be used for performing advanced analytics, and some as display of informative summaries in dashboards, some are intended for a small group of people and some for a big audience. To serve different users' needs, for one-way as well as two-way communication, there are a number of possibilities available. - Spotfire clients and user roles
When you are working with Spotfire as an author, you can create analyses either using the installed client or using the web client. Even though much of the functionality is available in the web client, the installed client allows you to do more.