Using OVER statement to reference data slices
Custom expressions are evaluated on the slices of the data, represented by the markers in the visualization. You use OVER statements in custom expressions, when you want to include also data from outside of the current slice in the evaluation of an expression.
To explain what it means to include data from outside of the current slice, see the image below. A similar image is used to illustrate the slicing and marker concepts, which are essential to understand when working with custom expressions, particularly custom expressions that contain an OVER statement.
The big box symbolizes all rows in a data table containing yearly sales in different regions for some fruit types, and the cubes symbolize different slices of the data.
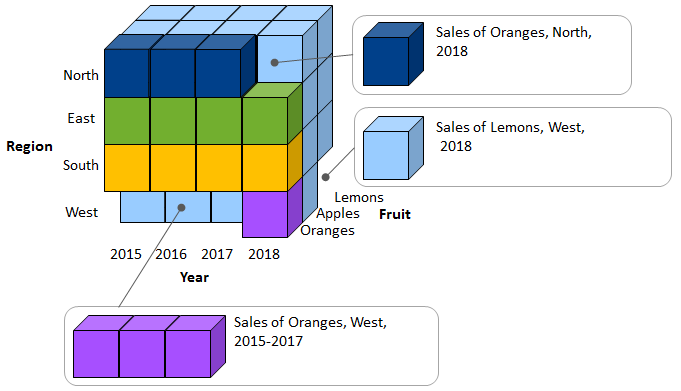
Assume that you want to compare Sales of Oranges, North, 2018 to Sales of Lemons, West, 2018, or to Sales of Oranges, West, 2015-2017. That is, in such an expression you need to reference data slices outside Sales of Oranges, North, 2018, which is done by using the OVER statement. The OVER statement lets you open up new ways of grouping data to be referenced in the expressions.
The easiest way to explain how to write OVER statements in expressions, and how they work, is by means of examples.
Examples of OVER expressions
[Axis.X] or
[Axis.Color].
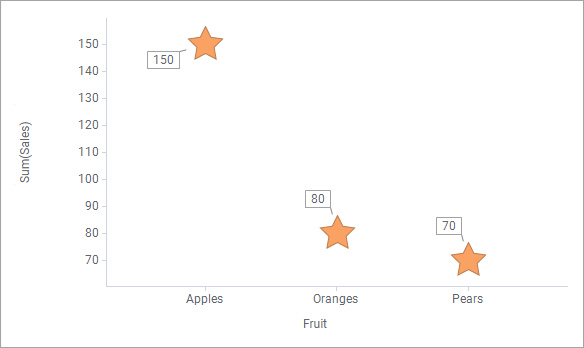
The scatter plot shows the sum of Sales for each Fruit; Apples, Oranges, and Pears. The total Sales amount is 300.
When the expression
Sum([Sales]) OVER (All([Axis.X]))
is specified on the Y-axis, every marker is re-evaluated, and the scatter plot changes to:
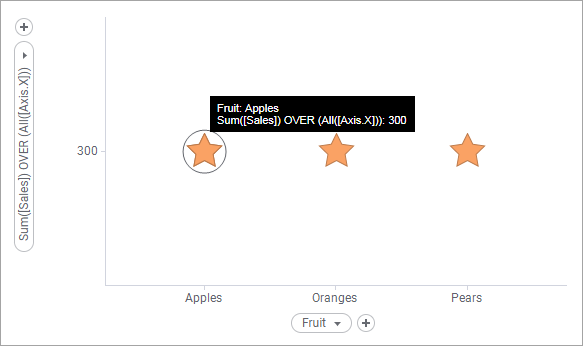
To understand the result, take the marker presenting Sum of Sales,
Apples, as example. The custom expression implies that the marker shall
re-evaluate to show the sum of sales for all X-axis slices, that is the sum of
both Apples, Oranges, and Pears sales (150+80+70). The same goes for the other
markers, so all markers end up in identical values. In fact, the
OVER (All([Axis.X])) part of the expression implies
that the slicing on the X-axis is ignored!
In the next example, further slicing of the data is made, as year is specified on the color axis.
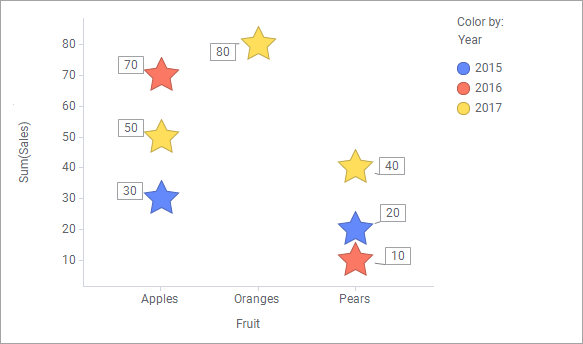
Change the Y-axis to the following expression:
Sum([Sales]) OVER (All([Axis.Color]))
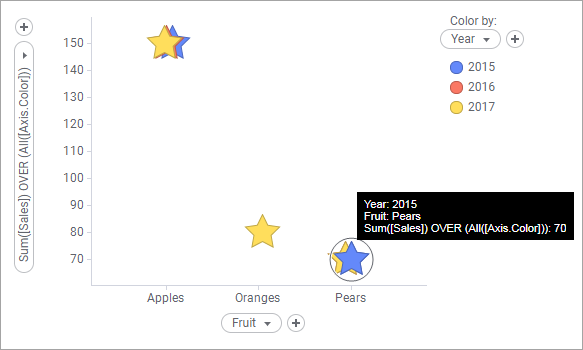
This custom expression implies that each marker shall re-evaluate to show the sum of sales of all color slices, as a matter of fact, ignore the slicing made by color.
Take Pears, 2015, as example (the blue Pears star). The marker's new value shows the sum of pears sales for all three years (40+20+10). All markers within a fruit type get the same Y-axis value, no matter color (Year).
There is no practical use of the examples above, but they serve as a means to understand how the OVER statement works in combination with the so called node navigation methods.
Using OVER statements in calculated columns
Using the OVER statement in calculated columns works differently from using it in custom expressions. In calculated columns, it might lead to fewer records.