When data is located in Microsoft SQL Server Analysis Services cubes it behaves rather different compared to data in the relational databases traditionally accessed via Spotfire. In relational databases the facts are directly available in the database tables. In the cube, all facts are already aggregated by the cube administrator.
A cube is built from several predefined combinations of hierarchies, which could be either attribute hierarchies or user hierarchies defined using dimension attributes, see below.
Dimensions and Dimension Attributes
A dimension in this context is, for example, time, product, customer, region, etc. An attribute is some kind of categorization. For each dimension, you can be interested in a number of different dimension attributes. For example, the "Product" dimension may be investigated with regard to the attributes "Product.Color" or "Product.Model". The dimension can be the same on multiple sides of the cube as long as each side represents a different attribute, for example, Product.Color and Product.Model.
Measures
Connected to each set of dimension attributes are measures, or aggregated facts, such as sales figures, cost, sales volumes, etc. A measure is the aggregation of values from the fact column that you want to analyze; it is not a numeric column.
Note: A volume can be an attribute and not a measure in some cases; the volume of a container is a dimension attribute but the volume of delivery would be a measure.
Measure groups are collections of facts that may come from different database tables.
Hierarchies
Hierarchies are multilevel sets of dimension attributes. They can be of the following types:
Attribute hierarchies are hierarchies with one column. In the cube, they contain both the "All" member which represents the total of all the individual members plus the column with the individual members. Attribute hierarchies map to a single column in Spotfire.
User hierarchies are composed of different dimension attributes. They can be used to navigate from a wider perspective to a more narrow one within Spotfire. For example, a user hierarchy may go from Country to State to City to Postal Code, and so on. User hierarchies map to hierarchies in Spotfire.
Example
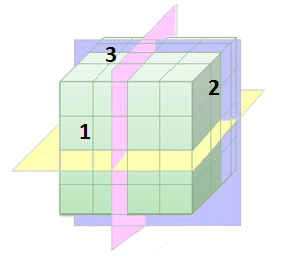
In the schematic image above, the sides of the cube could be said to represent different hierarchies.
As a simplification, if side 1 represents product type, side 2 is a time unit and 3 is region, then the cube could be queried in several different ways: the yellow plane could mean "Show sales per product for different years.", the pink plane represents "Show sales per product in different regions." and the blue plane "Show sales per region for different years.".
Predefined Queries
When a query is sent to the cube it is common to ask for measures aggregated over a number of different hierarchies. For example, you may want to look for the sum of sales for all product types in all regions during the last three years. All questions that you might have should already be anticipated and set up in the cube by the cube administrator.
In a cube query, you always include all the hierarchies of the cube even if you do not specify them. That is the reason why cube queries are always aggregated. If no hierarchy is specified in a query, then the default is used. This is usually all possible items or the total of the value (for example, you would get the value for the whole country rather than split by cities). Theoretically, you could split a query enough to return the actual values from the underlying data warehouse, but the cube would still consider the query as aggregated.
Microsoft SQL Server Analysis Services Cubes in Spotfire
Since cube data is already aggregated from the start, there is no need to do any aggregations within Spotfire. Instead, Spotfire can be used as a way to display the related combinations of measures and hierarchies in measure groups set up by the cube administrator. By taking advantage of the natural structure of the cube you can make sure that you are viewing relevant data. The free-dimensionality of Spotfire does otherwise allow you to make combinations of measures and dimensions from the cube that do not always make any sense, or lead to "The expression is not valid"-messages in the visualizations.
Normally, you would use measures on axes where actual values are to be displayed, such as, on the value axis of a bar chart, or as cell values in a cross table. "Dimension columns", that is, attribute hierarchies and user hierarchies, can be used to split the viewed data into smaller subsets on categorical axes.
When looking at cube data in the data panel you have the possibility to select one measure group and one related dimension at a time, which may help you selecting suitable options on the axes. The whole cube is loaded as a single data table in Spotfire.
There are also other implications of working with cube data. Since the measures are defined by the context of a dimension, it is not possible to create filters for measures.
Dynamic named sets are dynamic columns in the cube. For example, one set may show the Top 50 customers and this could either be displayed over different countries in the world or within a single country when using standard cube reporting tools. When you are working with dynamic named sets in Spotfire, the content of a dynamic named set column depends on the current context; the current filtering. Therefore, the axis expression must be evaluated after the current filtering is applied when dynamic sets are used in visualizations. This is a change from how axes traditionally are evaluated in Spotfire, but it is applied automatically when you are placing a dynamic named set column on an axis. See Details on Advanced Settings for more information about axis evaluation settings.
See also:
Details on Microsoft SQL Server Analysis Services Connection