If you have selected to load data on demand, and specified a marking that should control what data to be loaded you will end up with the following scenario:
When you mark items in a visualization that uses the specified marking, the data for the on-demand data table is updated. The update can either be done automatically each time you change the marking, or manually by clicking on the refresh button displayed when the marking is changed.
This way, you can create a master visualization in which to specify the item of interest and a details visualization where more information about the marked item is loaded from the database only when requested.
To set up a marking controlled on-demand data table:
When one identifier column in the first data table is matched by an identifier column in the on-demand data table, the on-demand data table should be set up using the following steps:
Select File > Add Data Tables....
Response: The Add Data Tables dialog is displayed.
Click Add and select the data source (an information link or a data connection). In this example, we use an information link.
Response: The Select Information Link dialog is displayed.
Browse to the information link holding the desired data and select it in the list.
Click OK.
Response: The information link is added to the Data tables list in the Add Data Tables dialog.
If desired, change the Name for the new on-demand data table.
Select the Load on demand check box.
Click on Settings....
Response: The On-Demand Settings dialog is displayed.
In the Define input for parameters that should control loading list, click to select the column in the information link that contains the identifiers.
Click Define Input....
Response: The Define Input dialog is displayed.
In the Input for the selected parameter list, select Values from column.
Select the Data table used by the master visualization.
Select the Column containing identifiers in the master data table.
Make sure that the Marked rows check box is selected and that only the check box for the marking used in the main visualization is selected.
Click OK to close the Define Input dialog.
Use the Load automatically check box to determine whether to reload data as soon as the input conditions change or using a manual update only.
Comment: This setting can be changed later on in the Data Table Properties dialog.
Click OK to close the On-Demand Settings dialog.
Comment: You might also want to add a relation between the two data tables, so the marked rows from the master data table also become marked in the on-demand data table visualizations. This can be done directly in the Add Data Tables dialog or later in the Data Table Properties dialog. See Data Table Properties - Relations for more information.
Click OK.
Response: The on-demand data table is loaded and a default visualization is created. The data shown in any visualization based on the on-demand data table will depend on what is marked in the master visualization.
Example of on-demand-loaded data table with manual update:
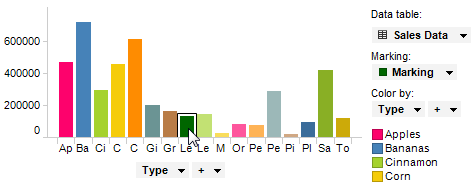
Click on an item in the master visualization:
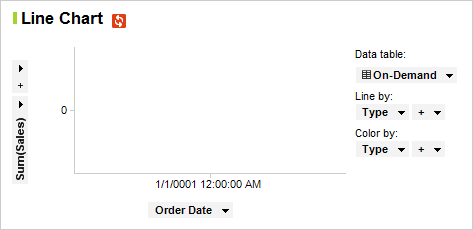
The refresh button of the visualization based on the on-demand-loaded data table appears in the title bar. (If nothing was marked from the beginning, the on-demand visualization will be empty until the first refresh.) Click on refresh.
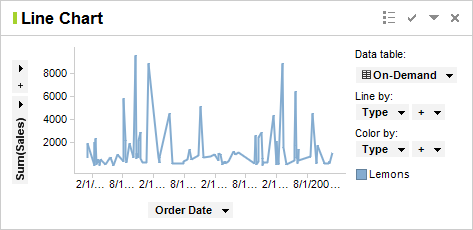
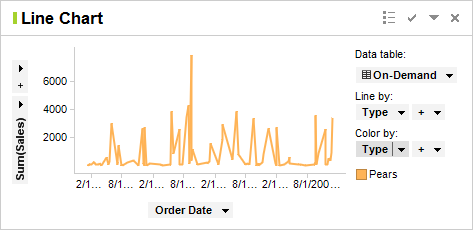
The visualization is updated to show details about the marked item:
Clicking on a different item in the master visualization once again displays the refresh button.
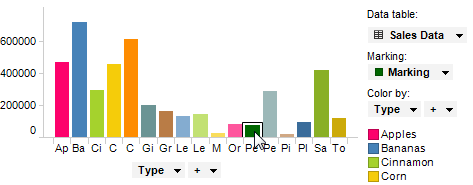
Click refresh to update the on-demand visualization to use the new marking:
See also:
Example of Property-Controlled On-Demand Data
What is a Details Visualization?