 , or select
View > Data.
, or select
View > Data. When adding a data table to an analysis, the visualizations you create initially represent the entire set of the data in the table. But what data is included in a visualization does not have to be static. You can filter to data values in which you are particularly interested, and base a visualization on these only.
When filtering, data values are filtered out in the data table, and only the remaining, filtered values are included in what is being visualized. All visualizations that are based on the data table in the analysis will immediately update to reflect only the filtered values. However, you can anytime change what is filtered, or return to the full set of data, or even take manual control of what data is shown in a particular visualization or on a page in the analysis.
Each column in the data table is represented by a filter. When a column value is filtered out, every row that contains that value in the data table will temporarily be taken away.
The filters are available in the data panel and the filters panel, and they can also be controlled from text areas. The filters are of different types depending on what type of data the column contains. You can, if you like, right-click a filter and select another filter type. To get an overview of the filter types, see What is the Filters Panel?.
Filtering from the Data Panel
If the data panel is not visible, click the Data button
on the toolbar, , or select
View > Data.
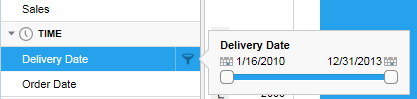
Locate the column in the panel, then hover with the cursor
over it, and click the Show filter button, , that appears.
Use the opened filter to limit the data.
, that appears.
Use the opened filter to limit the data.
Filtering from the Filters Panel
If the filters panel is not visible, click the Filters
button on the toolbar, ![]() , or select View
> Filters.
, or select View
> Filters.
Locate the filter in the panel, and filter to the wanted values.
Filtering from Text Areas
Filtering can also be performed from text areas provided that they have been set up to include filters. For more information, see How to Use the Text Area.
Information about Filtered Data
How many rows that remain after values in the columns have been filtered out, and the total number of rows in the data table, can be viewed from the status bar at the bottom of the Spotfire application window.

Details about which columns have been filtered, and to which values, are displayed at the bottom of the data panel and the filters panel. If you want to modify what has been filtered in a filter, you can open the filter from here by simply clicking it.
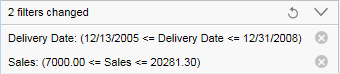
Above, the expanded view is shown. To collapse the filter
details, click the  button.
Filtering can be reset. Click the  button to reset separate filters, and the
  button to
reset all filters.
button to
reset all filters.
See also: