When you load data into Spotfire, each column in the data table is represented by a filter. In the filters panel, all filters in a data table can be viewed at the same time, and you can use the filters directly to limit the data to visualize. The filters are of different types depending on what type of data the column contains.
The filters in the filters panel can be organized just as you please, and also hidden. In case the analysis holds different filtering schemes, the filters panel is where you select which filtering scheme to apply on the page.
The filters panel can be displayed as a popover or a docked
panel. See Panels and
Popovers for more information. Click on the Filters button on the
toolbar, ![]() , or select View > Filters to show, or hide,
the panel. It will open in the mode it was opened the last time you
had it open. The visibility of the panel is controlled per page, and the
Filters visibility of new pages is inherited from the active page. The
image below shows Filters as a docked panel with the different filter
types.
, or select View > Filters to show, or hide,
the panel. It will open in the mode it was opened the last time you
had it open. The visibility of the panel is controlled per page, and the
Filters visibility of new pages is inherited from the active page. The
image below shows Filters as a docked panel with the different filter
types.
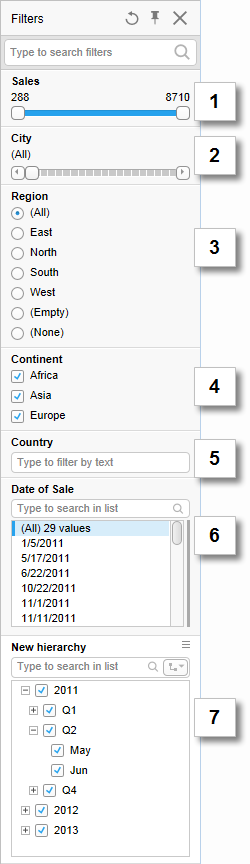
Number |
Filter Type |
1 |
Range Filter |
2 |
Item Filter |
3 |
Radio Button Filter |
4 |
Check Box Filter |
5 |
Text Filter |
6 |
List Box Filter |
7 |
Hierarchy Filter |
Note: Binary columns cannot be represented by filters.
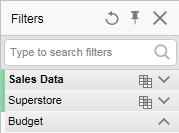
When more than one data table is available in the analysis, data table headers are automatically displayed above the filters. The active data table is indicated by bold typeface and a color stripe. The color stripes also appear to the left of the filters in the data table. Related data tables are indicated by stripes of the same colors as seen in the image below.
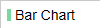
Visualizations also get a color stripe in the title bar, indicating which data table the visualization is based on, when more than one data table is available in the analysis.
Information about Filtered Data
Details about which columns have been filtered, and to which values, are displayed at the bottom of the filters panel. If you want to modify what has been filtered in a filter, you can open the filter from here by simply clicking it.
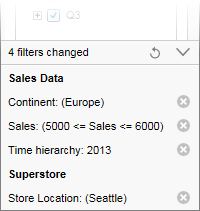
Above, the expanded view is shown. To collapse the filter
details, click the  button.
Filters can be reset to their original state (all values selected) in different ways:
You can click the  buttons above to reset
separate filters.
buttons above to reset
separate filters.
You can right-click a filter in the upper section of the filters panel and select Reset Filter.
You
can click the  button above or select
Reset All Filters, either from the pop-up
menu in the filters panel, in the data
panel, on the toolbar, or from the Edit menu, to return
all filters, visible or hidden, in the active filtering scheme to
their original state.
button above or select
Reset All Filters, either from the pop-up
menu in the filters panel, in the data
panel, on the toolbar, or from the Edit menu, to return
all filters, visible or hidden, in the active filtering scheme to
their original state.
If you want to reset only visible filters, click the Reset Visible Filters button in the header of the filters panel.
Note that resetting filters will only affect modifications related to filtering of the data, for example, if you have cleared any check boxes in a check box filter, or narrowed down the range of values in a range filter. Other changes, such as renaming a filter, changing the filter type or scale, will not be affected.
See also: