Option |
Description |
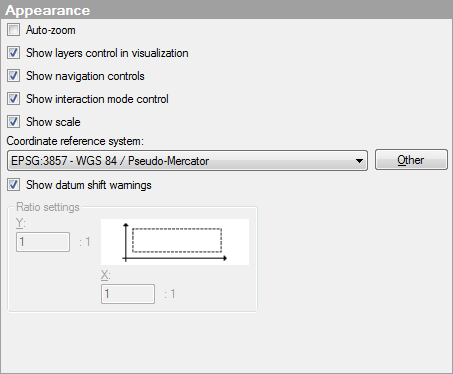
Auto-zoom |
If the check box is selected, the visualization is automatically zoomed in on the filtered markers or shapes. Each layer in the map chart (except the map layers) can be specified to be "Included in auto-zoom" or not, depending on whether the data or image should be taken into account or not. When using auto-zoom together with subsets and trellising, all trellis panels are taken into account, there is no individual zoom per panel. Note: To be able to zoom and pan using the navigation controls or keyboard shortcuts, Auto-zoom must be deselected. |
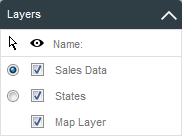
Shows or hides the Layers control:
The Layers control can be useful for getting an overview of the different layers in a visualization. You can show or hide layers and also switch the interactive layer. |
|
Show
navigation controls |
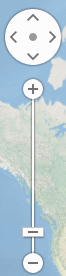
Shows or hides the navigation controls:
The navigation controls are used to zoom or pan in the map. |
Show
interaction mode control |
Shows or hides the interaction mode control:
The interaction mode control allows you to switch between the mode where you can mark items and the mode where you can pan the map by clicking and dragging the map. |
Show
scale |
Shows or hides the scale at the bottom left part of the map:
Note: The scale is only possible to show if you use the coordinate reference system EPSG:3857-WGS 84 / Pseudo-Mercator. |
Allows you to specify the coordinate reference system for the appearance of the map chart. For more information, see What are Coordinate Reference Systems? |
|
Other |
Opens the Coordinate Reference Systems dialog that allows you to select a coordinate reference system not available in the drop-down list. |
Show
datum shift warnings |
Specifies whether or not a warning should be shown in the visualization if there are issues with datum shifts. There are cases when it is not possible to apply a datum shift to the map chart if coordinate reference systems with different datums are used. This can lead to a lower accuracy in the map chart. |
Ratio
settings |
[Only applicable when the Coordinate reference system is set to "None".] Allows you to specify the ratio of data values on the imaginary X- and Y-axes to spread values better on top of an image. By changing the ratio you can stretch the data range so that markers are evenly distributed over an area even if the actual values on the axes are of different dimensions. For example, if your X-values range from 0 to 10 and your Y-values range from 0 to 100, you can set the Y ratio to 10:1 for an even distribution of values. |
Y |
Sets the ratio of the Y-values. |
X |
Sets the ratio of the X-values. |
See also: