Working with Multiple Data Tables in One Visualization
Loading Multiple Data Tables into Spotfire
Loading many data tables into Spotfire works the same way
no matter if you are going to combine the data tables in one visualization
or not. See How to Add
Data Tables to learn more about loading data. After the data has been
loaded you may need to match columns in order to combine them in a visualization.
You can read more about this in Column
Matching and below.
If your analysis contains data from many data tables, it
can be useful to get an overview of which data tables have column matches
between them. The best way to get an overview is in the Data Table Properties
dialog.
Go to Edit
> Data Table Properties and open the Column
Matches tab.
In the Data
tables list, select the data table you want to view current
column matches for.
Response: The bottom part of the dialog is updated
to show the column matches for the selected data table. The data table
names are displayed in blue text, while the column names are displayed
in black text. The selected data table is always shown on the left-hand
side.
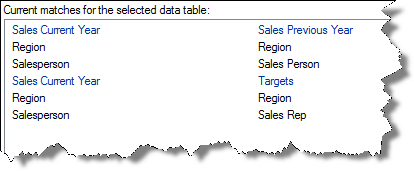
Here the column matches for the data table named
'Sales Current Year' are shown. The two columns 'Region' and 'Salesperson'
in 'Sales Current Year' have matches in the other two data tables.
In the data table named 'Sales Previous Year' they match the columns
named 'Region' and 'Sales Person' respectively. And in the data table
named 'Targets' they match the columns named 'Region' and 'Sales Rep'
respectively.
Load the data tables of interest
into Spotfire.
Go to Edit
> Data Table Properties and open the Column
Matches tab.
In the Data
tables list, select the data table you are going to use as
the main
data table in the visualization.
Click on the New...
button to the right of the list showing the Current
matches for the selected data table.
Response: The New
Match dialog is opened.
In the Right
data table drop-down list, select the data table containing
the column you want to match with a column in the Left
data table.
Comment: The data table in the Left data table
drop-down list is already set to the column you selected in step 3.
In the Left
matching column and Right matching column
selectors, choose the columns you want to add a match between.
If desired, apply transformations
to any of the columns.
Click OK
to close the dialog.
Response: The match has been added to the list
of Current matches for the selected data table.
If you want to add more matches
just repeat steps 3-7, and when you are done, click OK
to close the Data Table Properties dialog.
Response: The matches have now been added to the
selected data tables.
Sometimes you may want to see which column matches are
used in a certain visualization.
Open the Visualization Properties
for the visualization of interest, and go to the Data
page.
Scroll down to the bottom
of the page, where you will find the settings for Data
table matching.
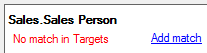
Under Columns
matched in this visualization, all the matches used in the
visualization are listed. If matches are missing, this will be indicated,
and you can add a match if necessary, see below. If a column has more
than one match to a column in another data table, you can select which
match to use. Detailed descriptions about these settings are available
in the help topics for Visualization Properties – Data page for any
visualization, for example the Cross
Table.
Open the Visualization Properties
for the visualization of interest, and go to the Data
page.
Scroll down to the bottom
of the page, where you will find the settings for Data
table matching.
Under Columns
matched in this visualization, locate the column that is missing
a match:
Click on the Add
match link.
Response: The New
Match dialog is opened.
In the Right
column selector, choose the column you want to match with the
column in the Left column selector.
Click OK
to close the dialog.
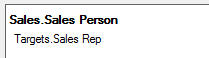
Response: The match has been added to the list
of Columns matched in this visualization:
Writing Expressions
In a visualization combining data from many data tables,
expressions will refer to the main data table by default. If you want
to refer to a column in another data table, you need to use the qualified
name: [Data Table Name].[Column Name].
For example: Sum([Sales Previous Year].[Sales]) where
'Sales Previous Year' is the data table name and 'Sales' is the name of
the column.
See also:
Multiple
Data Tables in One Visualization
Column
Matching
More
Examples