Option |
Description |
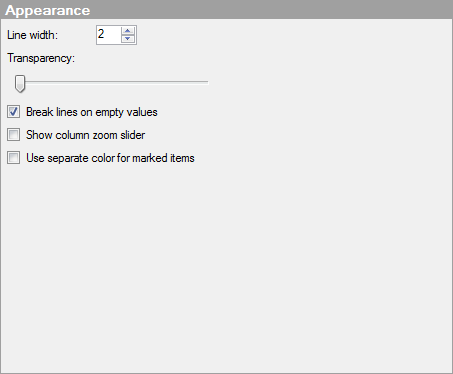
Line
width |
Specifies the width of the lines in the parallel coordinate plot. |
Transparency |
Drag the slider to change the transparency of the lines. Increasing transparency makes it easier to see where many lines are placed on top of each other in the parallel coordinate plot. |
Break
lines on empty values |
Determines whether lines should be broken or remain connected when an empty value is found in the data used to create the line. |
Show
column zoom slider |
Shows a zoom slider that you can manually manipulate to view only the interesting columns in the parallel coordinate plot. |
Use
separate color for marked items |
Select this check box to use the specified marking color to distinguish marked items in this visualization. If the check box is cleared, then unmarked items will be faded out instead, and the original color will be kept for the marked items. See Marking in Visualizations for more information. |
See also:
Parallel Coordinate Plot Properties
How to Use the Parallel Coordinate Plot
What is a Parallel Coordinate Plot?