Treemaps are ideal for displaying large amounts of hierarchically structured (tree-structured) data. The space in the visualization is split up into rectangles that are sized and ordered by a quantitative variable.
The levels in the hierarchy of the treemap are visualized as rectangles containing other rectangles. Each set of rectangles on the same level in the hierarchy represents a column or an expression in a data table. Each individual rectangle on a level in the hierarchy represents a category in a column. For example, a rectangle representing a continent may contain several rectangles representing countries in that continent. Each rectangle representing a country may in turn contain rectangles representing cities in these countries. You can create a treemap hierarchy directly in the visualization, or use an already defined hierarchy. To learn more, see the section To Create a Treemap Hierarchy.
A number of different algorithms can be used to determine how the rectangles in a treemap should be sized and ordered. The treemap in Spotfire uses a squarified algorithm.
The rectangles in the treemap range in size from the top left corner of the visualization to the bottom right corner, with the largest rectangle positioned in the top left corner and the smallest rectangle in the bottom right corner. For hierarchies, that is, when the rectangles are nested, the same ordering of the rectangles is repeated for each rectangle in the treemap. This means that the size, and thereby also position, of a rectangle that contains other rectangles is decided by the sum of the areas of the contained rectangles.
Example:
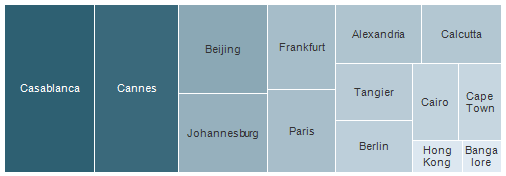
Below is a treemap where the rectangles represent cities and are sized and colored by the column Sales. In this case, the aggregation method Sum was selected for the Sales column. This treemap only contains data on one level.
The sizes and positions of the rectangles, as well as the coloring, indicate that Casablanca and Cannes have the highest total sum of sales, while Hong Kong and Bangalore have the lowest.
To compare sum of sales for entire countries or continents, you can add other levels to the treemap hierarchy without losing the information about the individual cities. In the treemap below, the columns Country and Continent were added to the treemap hierarchy.
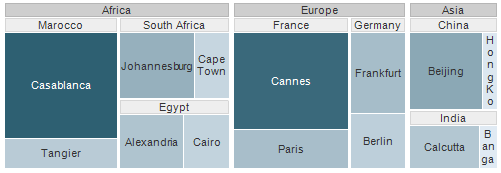
The rectangles are now nested. Each rectangle that represents a continent consists of rectangles representing countries within that continent. Each rectangle that represents a country consists of rectangles representing cities in that country. It is still possible to see which individual cities has the highest sum of sales, but it is now also easy to see that Africa is the continent with the highest total sum of sales, and that Asia is the continent with the lowest total sum of sales. Since the rectangles are now nested, the rectangles are not in the same positions anymore. However, each level of the hierarchy is still organized according to the squarified algorithm. For example, the size of the rectangle representing India is decided by the sum of the areas of the two rectangles representing Calcutta and Bangalore. The size of the rectangle representing Asia is in turn decided by the sum of the areas of the rectangles representing China and India.
To take a closer look at a certain part of the treemap, you can navigate from a higher hierarchy level to a lower one. Click on the hierarchy header of the level you want to navigate to. In the example below, the treemap is shown as it appears when you navigate down to the country level India.
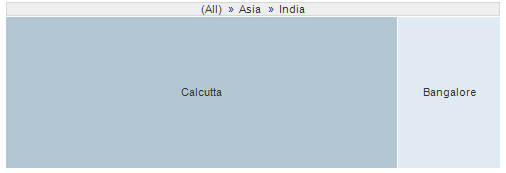
The uppermost hierarchy header now displays the hierarchy levels from the top level to the level you are currently viewing. To navigate upwards in the hierarchy, click on the level you want to navigate to.
You can hide both the hierarchy headers and the labels in the treemap at any time from the right-click menu of the visualization.
All visualizations can be set up to show data limited by one or more markings in other visualizations only (details visualizations). Treemaps can also be limited by one or more filterings. Another alternative is to set up a treemap without any filtering at all. See Limiting What is Shown in Visualizations for more information.
See also: