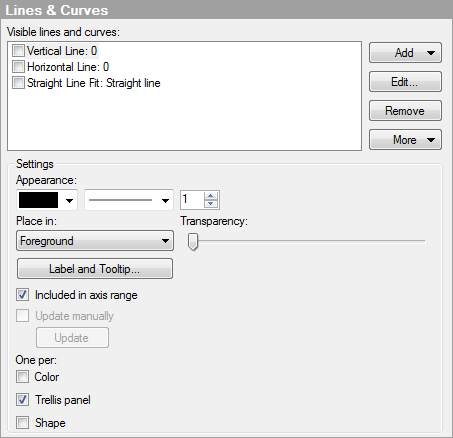
Some of the visualization types can display additional information in reference lines or several different types of curves. This is set up in the properties dialog of each appropriate visualization type. Here, the Lines and Curves page of the scatter plot properties is shown:
For example, you may want to show how well your data points adapt to a certain polynomial curve fit or to a logistic regression curve fit.
Curve fit (regression analysis) allows you to summarize a collection of sample data points by fitting them to a model that will describe the data and display a curve or a straight line on top of a visualization. The curve is normally not a fixed curve, but rather a line that can be changed upon changing the input data during filtering. However, you can always select to "freeze" the updating of a curve and only allow it to be updated manually.
Curve fitting can be used either to determine the parameter values of a known regression model or to find a model that fits the data better than other models. TIBCO Spotfire allows you to define your own curves, either directly from an expression or from an expression which is linked to a data table containing curve parameters. Note that whenever there is a reference to X or Y in lines or curves for a bar chart, X always refers to the category axis while Y refers to the value axis.
Transformations
The X- and Y-values used in the curve fitting are the plotted values, hence, they are affected by scaling. This means that if you use log scale you may want to apply a different curve fitting model than you would otherwise. For example, if you want to do logistic regression and have either log10-values or log10-scaled values on the X-axis, you should make sure to apply the setting "Assume that X is log10-transformed" in the Edit Curve dialog in order to obtain the expected results.
Limitations on data
Not all types of input data can be used to calculate curves using all different types of models.
All models require:
more than one data point to use in the calculation
that not all data points have the same X- and Y-values (lie on top of each other)
that not all data points have the same X-value
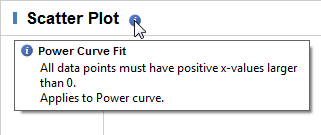
In addition, the logarithmic model, the power model and the logistic regression model require that all data points have positive X-values. The power model and the exponential model also require that all Y-values have the same sign (positive or negative).
The logistic regression requires that not all data points have the same Y-value. If any of the above limitations occur, no curve will be drawn and a notification will be displayed in the title bar of the visualization.
If you choose to export your calculation, any error message shown in this tooltip will also appear in the column "Notes" of the resulting export file. Note that this column always exists in the export file. If there are no errors, it will be empty.
For more information about exporting Lines and Curves, see Lines & Curves properties of the appropriate visualizations.
See also:
Scatter Plot Properties - Lines & Curves
Line Chart Properties - Lines & Curves
Box Plot Properties - Lines & Curves
Bar Chart Properties - Lines & Curves