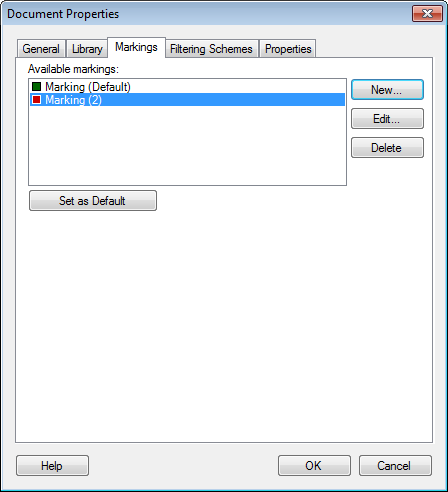
The Markings tab of the Document Properties dialog is where you specify which data table and marking to use as default when new visualizations are created. You can also add, edit or remove markings.
To reach the Document Properties dialog:
Select Edit > Document Properties.
Click on the Markings tab.
Markings Tab

Option |
Description |
Available
markings |
Lists all markings available in the document. A marking is what specifies the color of marked items from one or more data tables. |
New... |
Opens a dialog where you can specify the name and color of the new marking. |
Edit... |
Opens a dialog where you can change the name and color of the selected marking. |
Delete |
Deletes the selected marking. If any visualizations use the deleted marking, they will be set to not allow marking. This can be changed on the Data page of the Visualization Properties dialog for each visualization concerned. |
Set
as Default |
Sets the selected marking to be the default marking, that is, the marking that is used when new visualizations are created. |
See also:
Details on Document Properties - General
Details on Document Properties - Library
Details on Document Properties - Filtering Schemes
Details on Document Properties - Properties
Details on Document Properties – Scripts
How to Edit Document Properties