Exporting a visualization and include non-visible content
You can export a visualization to a PDF document. Sometimes the content in a visualization is extensive, and a scroll bar is added to make it accessible. When you export such a visualization, it is possible to export the entire content, that is, include also the content that is currently non-visible.
To export only what is visible in the visualization, see Exporting a visualization.
Visualizations whose entire content might not be visible are visualizations trellised by page, or tabular visualizations (table, cross table, summary table, and graphical table).Procedure
-
To export also what is not visible in the visualization, select the
Export all trellis pages check box for trellised visualizations, or the
Export entire table check box for tabular visualizations.
Depending on the type of visualization, and its current configuration, you encounter some of the check boxes listed below:
Check box Description Show visualization title Specify whether or not the visualization title should be included in the export. Show legend Specify whether or not the legend should be included in the export.
Consider clearing the check box if the legend information is redundant, or if more space is wanted.
Show axis selectors Select this check box to include all axis selectors in the export, or clear it to hide them. If the axis selectors do not add value to the visualization, consider hiding them to free more space.
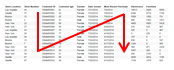
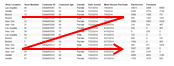
Columns first, then rows Tabular visualizations that fill up more than one PDF page are by default exported so that rows are exported first and then the columns: Select this check box to instead export the columns first and then the rows:
Repeat column headers For tabular visualizations, select this check box to display column headers on each PDF page on which the visualization continues. Repeat row headers For cross tables, select this check box to display row headers on each PDF page on which the visualization continues. Keep hierarchy levels together Select this check box to, as far as possible, display items on the lowest level in a hierarchy on the same PDF page. Repeat frozen columns If columns are frozen in a table visualization, select this check box to display these columns on every PDF page on which the table visualization continues.