Creating a KPI chart
A KPI chart is used to quickly inform about the current performance of a company or organization. You create different KPIs, Key Performance Indicators, which measure factors that are crucial to monitor, and present them in a grid of tiles. Examples of KPIs to monitor are net revenue, sales growth, or customer satisfaction.
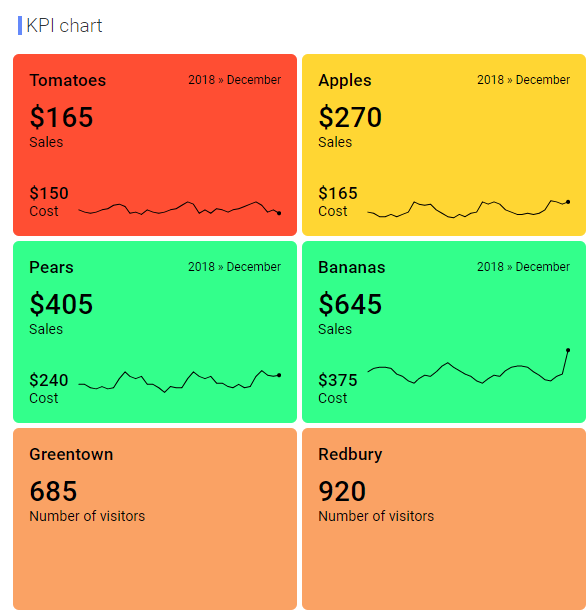
A single KPI chart can hold KPIs showing different types of measures. In the image above, one KPI shows sales and cost data and another KPI shows data about visitors. Each individual KPI can be split into tiles that represent different categories in your data.
You have different options to arrange the tiles from the different KPIs in a single KPI chart. You can, for example, gather tiles where the KPIs show good performance at the top of the chart, or you can sort them alphabetically. That is, tiles from different KPIs can be mixed, and their values can be based on data from different data tables.
 to open the flyout.