Working with colors
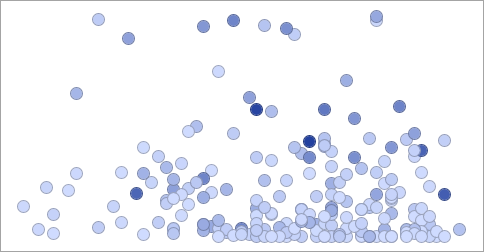
Colors can be used to add further information to a visualization. You can color items to, for example, draw attention to certain items, distinguish particular categories of data, present variation in values, or identify outliers.
On the Color by axis in the visualization, you select the column whose values you want to color the items by. The column can be any of the columns that are already selected on any other axis in the visualization, or totally different ones. Depending on whether the selected column contains categorical values or numerical values, you have different coloring options.
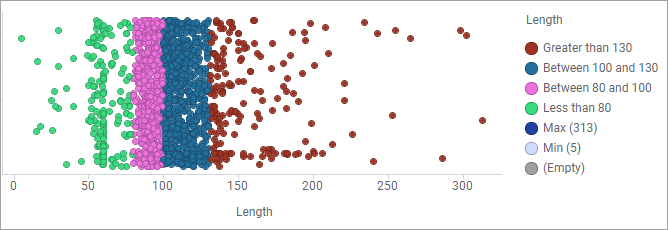
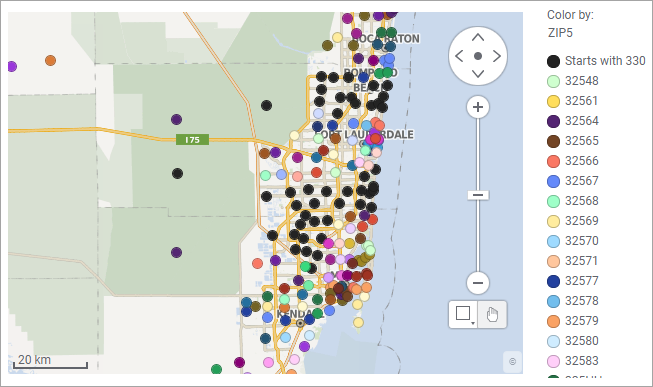
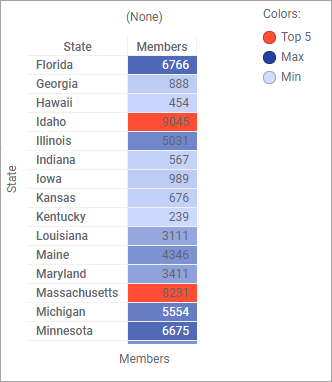
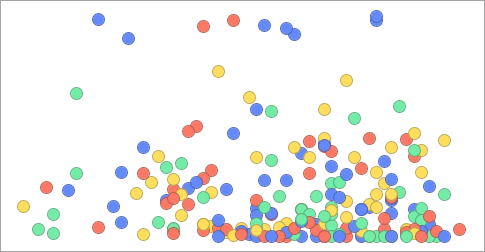
Examples of how colors can add more information to visualizations are shown below. You find the details of the coloring in the legends.
Which color is assigned to a certain value can easily be changed. Simply click the colored circle in the legend, and pick another color in the palette that is displayed.
Distinct colors and gradient coloring
Different coloring possibilities are provided depending on whether the selected column on the Color by axis contains categorical values or numerical values. Categorical values are values that can be divided into groups such as gender or country, and numerical values are quantitative data such as sales figures or distances.
- When you use categorical data on the color axis, all items within a category are given a common, distinct color.
Color rules
It is possible to make deviations from the rest of the coloring. For example, you may want top value items stand out using a certain color, or values with identical start characters, or you may want to color items in a certain interval differently. To do so, you specify rules containing conditions for the coloring. Items that match your condition are colored according to your rule instead of following the rest of the coloring pattern. It is possible to add several color rules to a visualization.
The top image shows some examples of visualizations where color rules have been specified.
Color schemes
Finally, you can color the visualization items using a predefined color scheme. Which predefined color schemes are available differs depending on type of data values in the column. Some of the color schemes have built-in color rules. You can use a predefined color scheme as it is, or use it as starting point for your adjustments.

