You can show the values of the bars and blocks in the waterfall
chart.
About this task
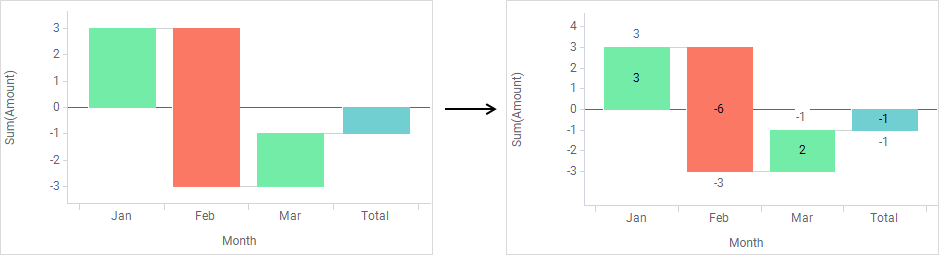
The values of the actual
blocks as well as the running totals can be displayed.
Procedure
-
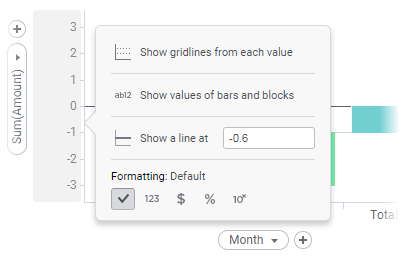
Place the cursor on the value axis.
The axis is highlighted.
-
Click the highlighted area to access a pop-up menu.
-
Select
Show values of bars and blocks.
Note: If you want to
remove the values from the bars and blocks, repeat the steps above.
Tip: It is
possible to display either running total labels or block labels. Open the
Properties popover, click
Labels, and select
Running totals or
Blocks, respectively.