Showing waterfall per categorical color
In a waterfall chart where a categorical coloring is applied, it is possible to show one waterfall per color.
Before you begin
Procedure
Example
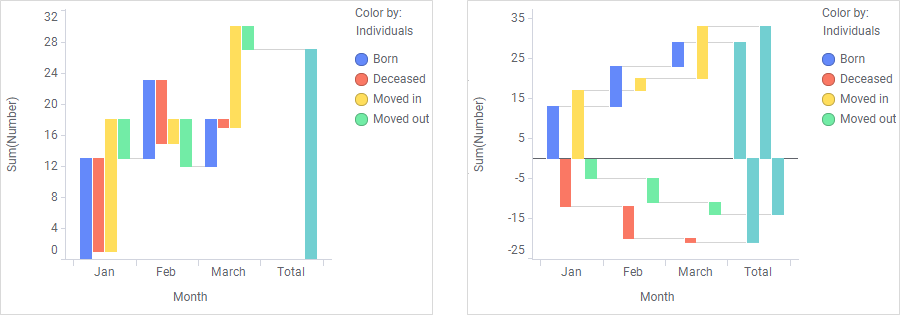
The waterfall charts below display population changes over time where
each contributing category to the total is represented by a certain color. In
the waterfall chart to the left, all categories are factors in the same
waterfall. The waterfall chart to the right shows the same data split into
separate waterfalls, one per categorical color.