Automatic Classification of Text
This example is based on the classic Reuters collection of documents. Specifically, 5,000 documents were selected from the Reuters-21578 database, which is a collection of 21,578 articles from Reuters that appeared on the newswires in 1987. The documents were assembled and indexed with categories by personnel from Reuters Ltd. in 1987. The copyright for these articles resides with Reuters Ltd. and Carnegie Group, Inc., and these files are available for research and demonstration purposes only. You can also review Chapter 16 in Manning and Schütze (2002) to learn more about these documents and the specific types of analyses illustrated in this example.
The body of the articles was placed into XML (Extensible Markup Language) files; following is an example of such a file.
The value of this collection of documents is that it was carefully coded by experts with respect to different content categories. The one of interest for this example is the Earnings category, i.e., the goal of this text mining project is to derive a simple classifier that enables us to automatically classify the articles as either dealing with earnings, or not (see also Manning and Schütze, 2002, p. 579).
Needless to say, the general utility of such methods that enable you to automatically classify large numbers of texts into certain categories (e.g., of interest or not of interest; or categories that allow for automated routing of documents to the appropriate offices, departments, etc.) can be immense. Once a good (accurate) classification method has been determined, hundreds or perhaps thousands of human work hours could be saved by implementing an automated system to perform necessary classifications of documents. (The Statistica system is ideally suited to implement such systems because it supports deployment of text mining results, and because the system is completely programmable so that it can be seamlessly integrated with existing electronic management systems, such as the Statistica Document Management System.)
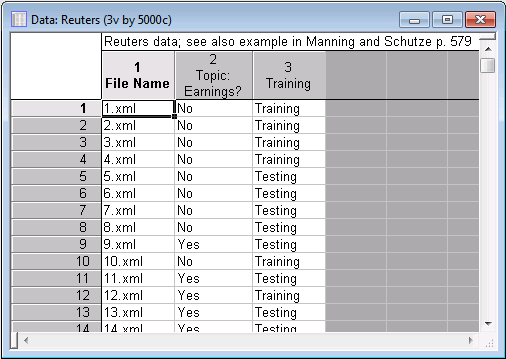
Data file with file references
To reiterate, the purpose of this analysis is to derive a model that will enable us to automatically determine whether a document is relevant to the Earnings category. The Statistica Text & Document Mining, Web Crawling system includes many options for retrieving documents or references to documents, including web or file crawling (see the Introductory Overview); in this case, the example data file Reuters.sta is used, which already contains the necessary information to retrieve all documents.
The variable File Name contains the actual file names to be explored. The second variable, Topic: Earnings?, is how the experts classified each document (as relevant or not relevant to Earnings). Also, there is a variable called Training that will later be used during cross-validation of the final model to evaluate its predictive validity and accuracy.
Specifying the Analysis
- Open the example data file Reuters.sta, and launch Text Miner.
- You can specify the analysis using:
- Ribbon bar: Select the Home tab. In the File group, click the arrow and select Open Examples to display the Open a Statistica Data File dialog box. Open the Datasets folder. The Reuters.sta data file is located in the TextMiner folder. Then, select the Data Mining tab. In the Text Mining group, click Text Mining to display the Text Mining dialog box.
- Classic menus: From the File menu, select Open Examples to display the Open a Statistica Data File dialog box. Open the Datasets folder. The Reuters.sta data file is located in the TextMiner folder. Then, from Data Mining menu, select Text & Document Mining to display the Text Mining dialog box.
- On the
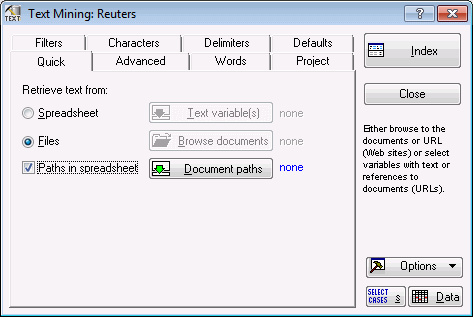
Quick tab, specify the source of text data (e.g., from spreadsheet cases, from files, or from a file in locations specified by in a spreadsheet column). Select the
Files option button, and select the
Paths in spreadsheet check box.
- Click the
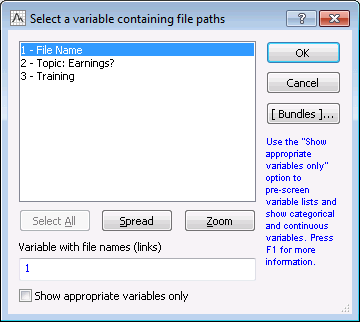
Document paths button to display a variable selection dialog box. Select the variable
File Name, which is the variable containing the complete references to the input document (XML) files.
- Click the OK button.
- Select the Advanced tab. Change the % of files where word occurs Min option to 3 in order to filter out infrequent words.
- Select the Words tab, and ensure that the Stop words (discarded, excluded from indexing) check box is selected. Click the adjacent Select button to display the Open Stop-Word (Text) File dialog box. Browse to and select the EnglishStoplist.txt file (in the TextMiner subdirectory of the Statistica Text Mining and Document Retrieval installation).
- Click the
Open button to load that file as the default stop list, i.e., the words and terms contained in that stop list will be excluded from the indexing that occurs during the processing of the documents. Refer also to the Introductory Overview for details.

Processing the Data Analysis
- Click the Index button in the Text Mining dialog box to begin the processing of the documents.
- After a few seconds, the
Results dialog box is displayed.
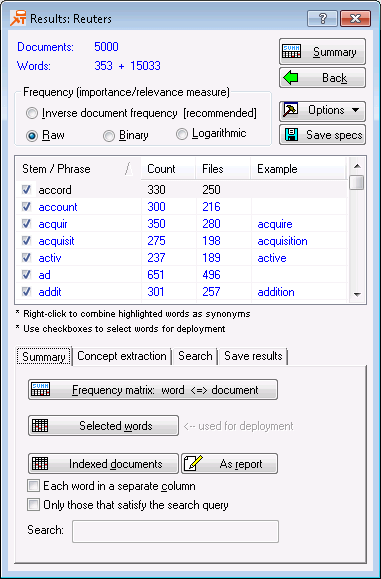
The options available at this point are described in some detail in the Introductory Overview, as well as in the documentation for the text mining Results dialog box. The primary goal of this research is to derive a good classification model for automatically classifying documents (news stories) as relevant or not relevant to Earnings.
Saving the Extracted Word Frequencies to the Input File
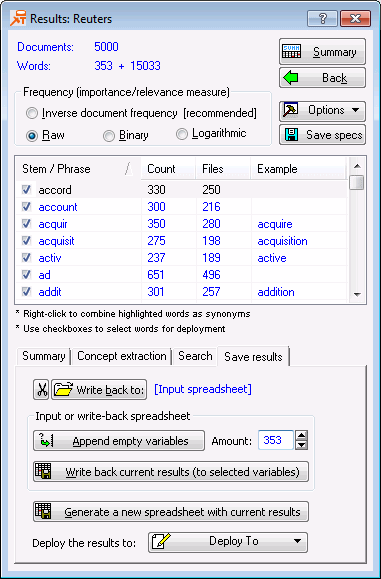
To write the extracted word frequencies back to the input file so that we can use these frequencies for further analyses. Select the Save Results tab. To write the 353 words that were extracted back into the input file, we need to first make room in the data file. To do this, enter 353 into the Amount field.
- Click the
Append empty variables button. If Reuters.sta was opened as a read-only file, you will be prompted to save the file to a different directory. A message is displayed confirming that the new variables were added to the data file.
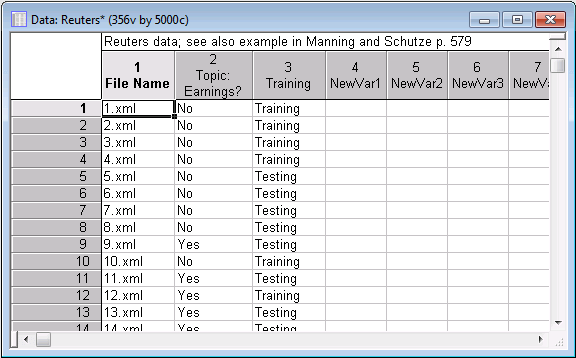
Three hundred and fifty-three new variables are appended to the input file.
- Click the
Write back current results (to selected variables) button to display the
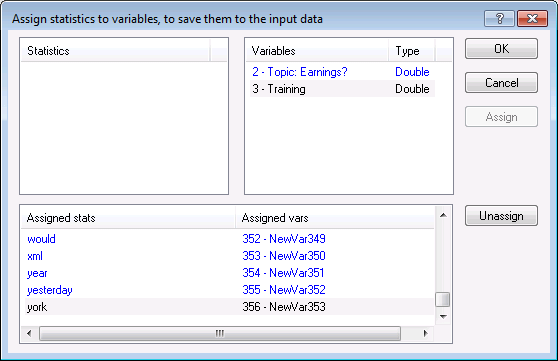
Assign statistics to variables, to save them to the input data dialog box. Select all extracted words (variables) in the left pane, and all newly created variables in the right pane.

- Click the
Assign button.
- Click
OK to complete this operation.

The newly added variables are automatically assigned the appropriate variable names to reflect the respective word that was extracted, and the respective frequency counts is automatically written to the new variables.
The Save As dialog box is displayed to save the updated spreadsheet.
These steps conclude the text-mining specific portion of this analysis. What remains is the task to build a good model for predicting the contents (Earnings - Yes/No) of the news stories so that we can automatically classify them.
Initial Feature Selection
- On the Data Mining tab, in the Tools group, click Feature Selection.
- On the menu, select
Feature Selection.
The Feature Selection and Variable Screening dialog box is displayed.
- Click the
Variables button.
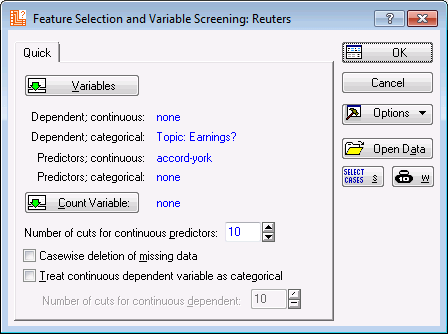
- Click OK in the Feature Selection and Variable Screening dialog box.
- The FSL Results dialog box is displayed.
- Specify to display the best 50 predictors of Topic: Earnings? (enter 50 into the Display field).
- Create the graph of the predictor importance (click the
Histogram of importance for best k predictors button).
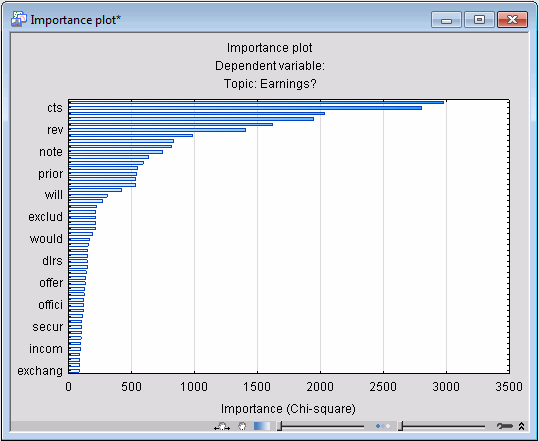
Judging from this plot, it may be sufficient to take only the first 20 or so predictors for final modeling (refer also to the Feature Selection and Variable Screening Overviews). We will use the best 20 variables (words) as the predictors for further model building, specifically, to use Classification and Regression Trees to build a final predictive model.
- In the Display field, specify to display 20 predictors, and click the Report of best k predictors (features) button to display the list of the best predictors in a report.
- Copy the 20 predictors to the Clipboard to be used in the
General Classification and Regression Trees (GC&RT) analysis.

General Classification and Regression Trees
- On the
Data Mining tab, in the
Trees/Partitioning group, click
C&RT to display the
General Classification and Regression Trees
dialog box. Standard
C&RT is selected by default.
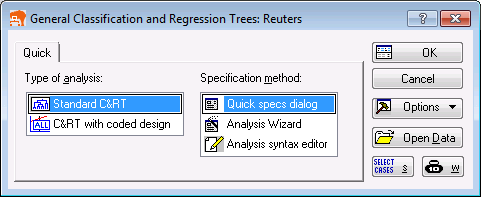
- Click the OK button to display the Standard C&RT dialog box.
- Select the Categorical response (categorical dependent variable) check box.
- Click the
Variables button and select variable Topic: Earnings? as the Dependent variable, and as the Continuous predictors select the best 20 predictors (paste them into the variable selection dialog box from the Clipboard) derived from the Feature Selection and Variable Screening analysis.

- Click
OK, and in the message concerning text variables, click the
Continue with current selection button.
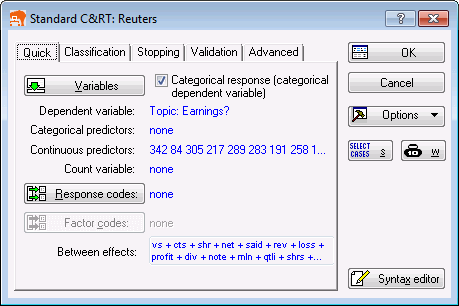
- On the Validation tab, select the V-fold crossvalidation check box (to automatically select a robust model).
- Click the
Test sample button and specify variable Training as a Test sample variable, with Code Training to define the sample from which we will build the model (we will use the remaining cases to test the predictive validity of the model).
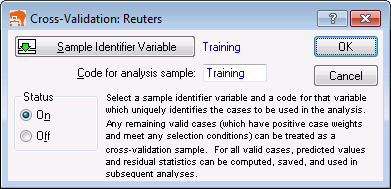
- Click OK in the Cross-Validation dialog box, and click OK in the Standard C&RT dialog box to begin the analysis and display the GC&RT Results dialog box.
- On the
Summary tab, click the
Tree graph button to review the final tree.

The final tree is similar, although not identical to that shown in Manning and Schütze (2002, Figure 16.1). Nevertheless, if you select the Classification tab of the GC&RT Results dialog box, select the Test set option button to compute the predicted classification for the (hold-out) test sample, and click the Predicted vs. observed by classes button, the following confusion (misclassification) matrix is computed.
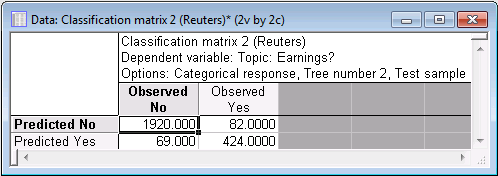
This translates into a classification model with a predictive accuracy rate of 94%.
Conclusion
This example illustrates how the various methods in Statistica Text Mining and Document Retrieval, along with Statistica Data Miner, can be used to build highly accurate predictive models for classifying text. The Statistica system is particularly well suited for this purpose because of the seamless integration of all components of the data and text mining facilities of the system.


