Example 2: Single Series ARIMA
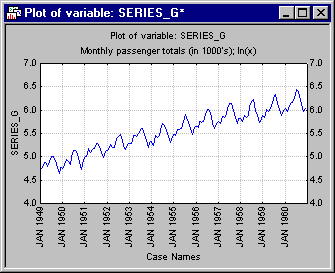
This example is based on Chapter 9 from the classic book on ARIMA by Box and Jenkins (1976). The data are the monthly passenger totals (measured in thousands) in international air travel, for twelve consecutive years: 1949-1960 (see Box and Jenkins, 1976, page 531, "Series G").
The data are partially listed below; they are also included with STATISTICA in example data file Series_G.sta. Open this data file via the File - Open Examples menu; it is in the Datasets folder.
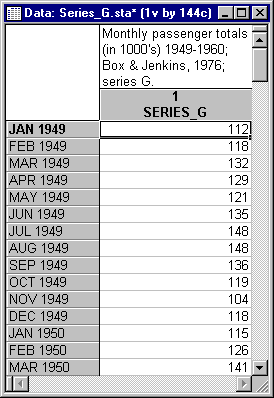
The series shows a clear growing trend over the years but at the same time there is strong seasonality present in the data (e.g., March figures are usually higher than February and April).
Specifying the Analysis
Identification Phase
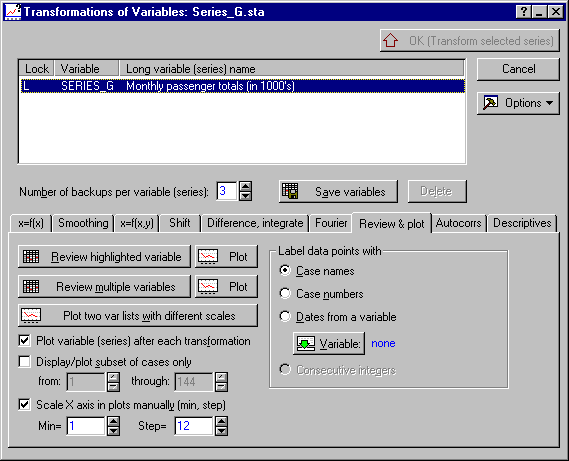
Before you can specify the parameters to be estimated in ARIMA, the model first has to be identified (see also the Introductory Overview). Although most of the necessary options such as Autocorrelations or Partial autocorrelations are available on this dialog, the transformation options will be used to illustrate how the nature of the ARIMA process can be identified. Therefore, click the Other transformations & plots button on the Advanced tab to display the Transformations of Variables dialog.
In this dialog, first select a more appropriate scaling for the horizontal x-axis in subsequent line plots. On the Review & plot tab, select the Scale X axis in plots manually check box, and then enter 1 as the Min, and 12 as the Step (12 months per year). Also, the data file Series_g.sta contains case names with the respective dates for each observation. You can use those labels to identify the different years in subsequent line plots; thus, select the Case names option button under Label data points with. These choices for the labeling and scaling of the horizontal x-axis in line plots are "module-wide"; that is, they will be used throughout the Time Series module whenever line plots of series are requested.
Refer to the description of the Review & plot tab for a detailed discussion of how line plots can be scaled and labeled in the Time Series module. The Transformations of Variables - Review and Plot tab will now look like this.
To produce a plot of the time series, click the Plot button next to the Review highlighted variable button.
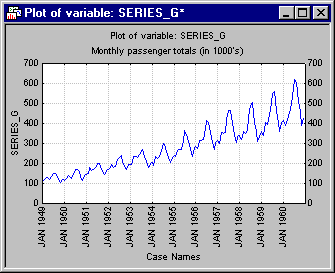
Both the trend and seasonality of the series are very apparent. In order to identify the specific lags for ARIMA differencing, autocorrelations and partial autocorrelations will be used (refer also to the Introductory Overview, for a general discussion of these statistics).
Multiplicative seasonality
It is also clear from the plot of the series that the amplitude of the seasonal changes increases over time (i.e., there is evidence of multiplicative seasonality, see the Introductory Overview), which may bias the values of autocorrelations. A natural-log transformation of the data will be performed to stabilize this variability.
Logarithmic transformation
Select the x=f(x) tab and select the Natural log (x=ln(x)) option button.

Now, click the OK (Transform selected series) button. After all observations have been transformed, the transformed series will automatically be plotted (by default, i.e., if you did not clear the Plot variable (series) after each transformation check box on the Review & plot tab).
Autocorrelations
Now, select the Autocorrs tab. Change the default value for the Number of lags parameter in the Autocorrelations & crosscorrelations box from 15 to 25. Then, click the Autocorrelations button to display a spreadsheet with the autocorrelations, and the autocorrelation plot.
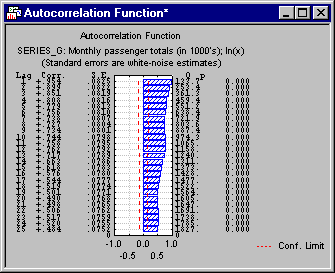
The plot indicates strong serial dependencies for lags of 1 to 12 with the highest value of autocorrelation for a lag of one.
Differencing
In order to remove the serial dependency, a nonseasonal differencing transformation will first be performed on the series, that is, difference it with lag of 1.
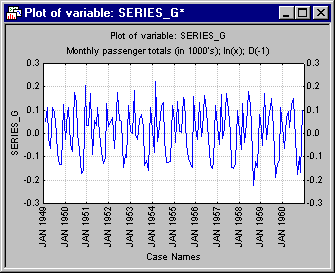
Now, each element of the transformed series represents the difference between its original (i.e., previous) value and the original value of its adjacent element. Note that the series is now shorter (by the number of elements equal to the lag, i.e., 1) since the first element of the series could not be differenced.
Return to the Transformations of Variables dialog, select the Autocorrs tab, and again click the Autocorrelations button.
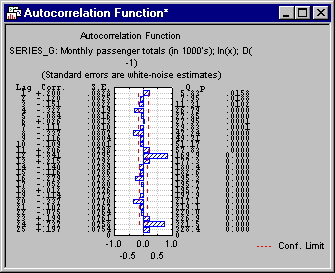
Not only the first order (i.e., for lag of 1) but also most other serial dependencies have disappeared (as explained before, autocorrelations for consecutive lags are interdependent).
Seasonal serial dependency
However, as it often happens, removal of the lower order serial dependencies exposed a higher order seasonality (for lag of 12). There is also a clear (seasonal) dependency for a lag of 24 (and other multiples of 12, such as 36, 48, etc.). This indicates a strong seasonal pattern. This dependency reflects the seasonality of airline traffic (there are months when people travel more and months when they travel less).
Seasonal differencing
Seasonal differencing with a lag of 12 will take care of this dependency. Return to the Difference, integrate tab. Select again the Differencing (x=x-x(lag)) option button, but change the lag value to 12. Then, click the OK (Transform selected series) button to perform the differencing transformation. Again, by default the transformed series will be plotted (clear the Plot variable (series) after each transformation check box on the Review & plot tab if you do not want to plot the series after each transformation). As before, bring the Autocorrs tab back up and click the Autocorrelations button.
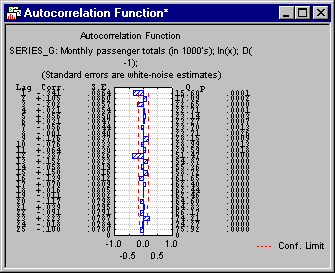
Most of the strong autocorrelations seemed to have been removed now. Even though there are still some autocorrelations which are larger than 2 times their standard errors (as indicated by the dotted line in the autocorrelation plot), one should be careful not to over-difference because this may cancel out the effects of moving average parameters.
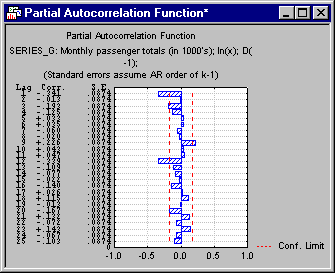
Now, click the Partial autocorrelations button (i.e., autocorrelations controlling for all "within-lag" correlations).
Parameters to be estimated
The correlogram looks well and the series is now ready for ARIMA. Based on the exploration of the nature of the series (i.e., the identification phase of ARIMA), a seasonal ARIMA (lag=12) will be run on data that will be differenced nonseasonally (lag=1) and seasonally (lag=12), and transformed (with natural logarithms) within ARIMA. Two moving average ARIMA parameters will be estimated: one seasonal (Qs) and one nonseasonal (q). No autoregressive parameters will be estimated. A review of the general rules of the identification phase of ARIMA is provided in the Introductory Overview. Refer to the book by Box and Jenkins (1976) for a more comprehensive discussion of this example (Box and Jenkins, 1976, Chapter 9). Hoff (1983), McCleary and Hay (1980), McDowall, McCleary, Meidinger, and Hay (1980), Pankratz (1983), and Vandaele (1983) discuss numerous examples of how to identify ARIMA models based on data plots and plots of auto-correlation and partial autocorrelation functions.
ARIMA Integrated Transformations
ARIMA Specifications Dialog
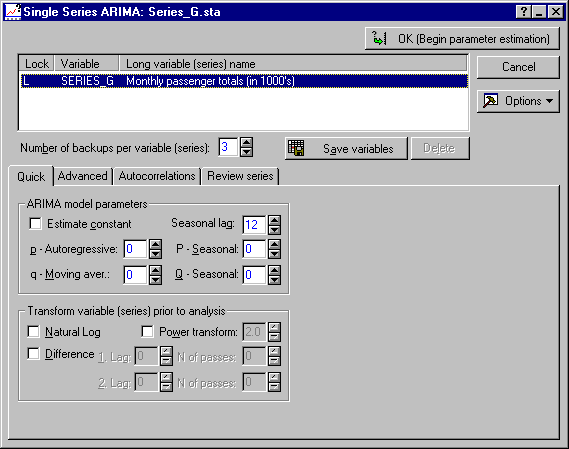
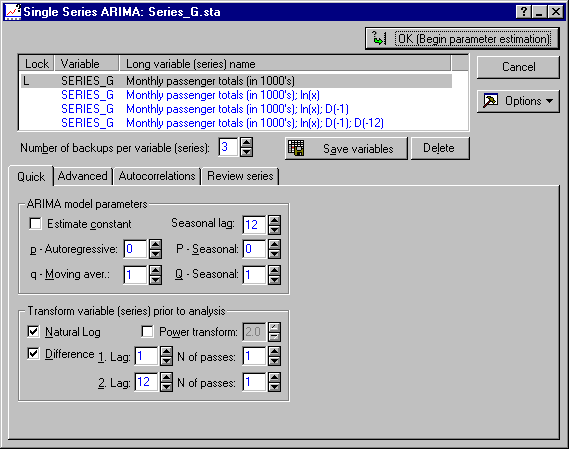
Now return to the Single Series ARIMA dialog by clicking the Cancel button in the Transformations of Variables dialog. Highlight the original (untransformed) variable Series_G. In the Single Series ARIMA dialog, you can specify autoregressive and moving average parameters to be estimated (seasonal or nonseasonal). You cannot proceed to the next step until at least one of the autoregressive or moving average parameters that are to be estimated (p, P, q, or Q) is selected. However, first you will have to specify the transformations and differencing.
In the Transform variable (series) prior to analysis group box on the Quick tab, select the Natural Log and Difference check boxes. Then, specify a 1. Lag of 1 and the N. of passes to 1. You have now specified the log-transformation and the non-seasonal simple differencing transformation. To specify the seasonal differencing transformation, specify in the 2. Lag box a lag of 12 and again set the N. of passes to 1.
ARIMA parameters. You still need to specify the ARIMA model parameters. You cannot start ARIMA until at least one of the autoregressive or moving average parameters to be estimated (p, P, q, or Q) has been requested. In the identification phase of ARIMA, it was decided to estimate two moving average parameters, one regular (q) and one seasonal (Q), and no autoregressive parameters. Shown below is the Single Series ARIMA dialog with all necessary settings in place.
Parameter estimation
As described in the Introductory Overview, parameter estimation in ARIMA models is accomplished by maximizing the likelihood (probability) of the data, given particular values of the parameters. The Time Series module offers two methods for computing the Maximum Likelihood value for a particular ARIMA model: Approximate (McLeod & Sales) (with or without backcasting) and Exact (Melard). The pro's and con's of each method are discussed in the Introductory Overview. For this example, select the Exact (Melard) option button on the Advanced tab. [Note that Box and Jenkins, 1976, used a recursive method with backcasting; to reproduce their results (page 319) select the Approximate (McLeod & Sales) option button and set Backcast cases to 13.] Next, click the OK (Begin parameter estimation) button, and the iterative parameter estimation procedure will begin (refer to the Introductory Overview for computational details).
Results

ARIMA output
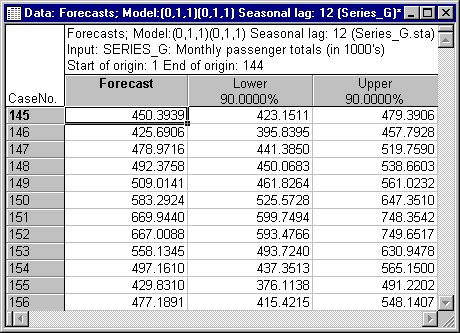
The summary box at the top of the Single Series ARIMA Results dialog summarizes the ARIMA specifications (ARIMA model, transformations), the parameter estimates, and their standard errors. Click the Summary: Parameter estimates button to review the parameter estimates in a spreadsheet.
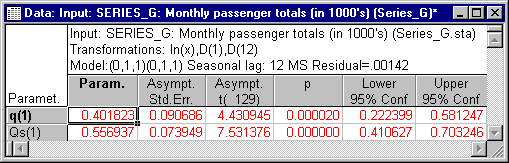
Both the non-seasonal and seasonal moving average parameters are highly statistically significant.
Forecast options
Plot of forecasts
A much better "picture" of how well the forecasts extend the observed series can be gained by plotting the forecasts, together with the observed values. Click the Plot series & forecasts button.
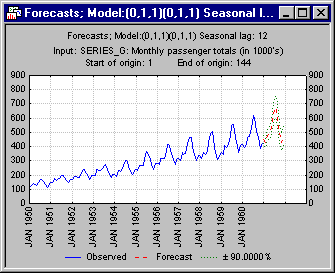
The plot displays the original series, forecasts, and their confidence limits (for the probability set in the Single Series ARIMA Results dialog); remember that earlier, you requested to label the horizontal x-axis of line plots with case names, and to use a step increment of 12 to accurately reflect the successive years. Reviewing the graph, the forecasts generated by your ARIMA model seem to extend the observed series in a reasonable manner.
Return to the Single Series ARIMA Results - Advanced tab in order to see how well the current ARIMA model will predict the last 12 observed cases of the series. Set the Start at case box to 133 (i.e., 144-12+1) and then click again the Plot series & forecasts button.
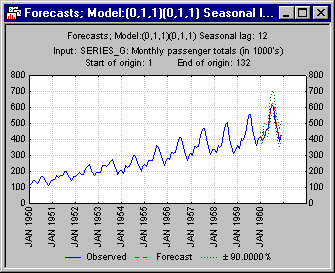
Again, the two-parameter ARIMA model seems to fit the series very well, and the observed values are well within the confidence band of predicted values.
Analysis of Residuals
So far, it looks like the model produces an adequate fit to the data. However, there are other important diagnostics that you should review. Two important assumptions of the ARIMA model are that 1) the residuals (observed minus predicted values) are normally distributed, and 2) that they are independent of each other, that is, that there is no residual serial correlation "left in the data." If the latter condition is not met, then you probably have overlooked an additional parameter that is "driving" the series (the underlying ARIMA process that produces the time series values).
Normal probability plots
The first assumption -- normal distribution of residuals -- can be tested by examining the normal probability plots of residuals. Shown below are the Normal and Detrended normal probability plots (click these button on the Distribution of residuals tab).
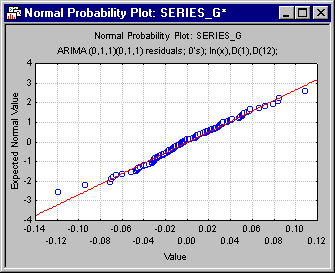

The way the standard Normal plot is constructed is as follows. First the residuals are rank ordered. From these ranks you can compute z values (i.e., standardized values of the normal distribution) based on the assumption that the residuals come from a normal distribution. These z values are plotted on the y-axis in the plot. If the residuals (plotted on the x-axis) are normally distributed, then all points should fall onto a straight line in the plot, as is the case in the plot shown above.
The Detrended normal probability plot is constructed in the same way as the standard normal probability plot, except that, before the plot is produced, the linear trend is removed. This often "spreads out" the plot, thereby allowing you to detect patterns of deviations more easily. In the plot above, most residuals cluster closely around the horizontal line, and again it looks like the residuals are indeed normally distributed. Click the Histogram button to see how well the normal distribution fits the actual distribution of residuals.

Autocorrelation of residuals
Now, turn your attention to the second assumption of ARIMA -- that the residuals are independent of each other. This can be tested by plotting the autocorrelation function (click the Autocorrelations button on the Autocorrelations tab).
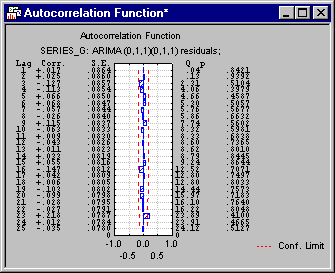
It is apparent in the plot above, that there is practically no residual autocorrelation left after you fit the current ARIMA model to the data. Therefore, you can be satisfied that the condition of independent residuals is also met.
Further Analyses
When you exit the Single Series ARIMA Results dialog, the ARIMA residuals will automatically be appended to the active work area. Also, if the Append forecasts to original series on Exit check box is selected (which it is by default) on the Advanced tab, another series with the original data and the forecasts will be appended to the active work area. Now, exit the Single Series ARIMA Results dialog by clicking the Cancel button; the Single Series ARIMA dialog will again be displayed.

As you can see, both the residuals and forecasts were added to the active work area. To "finish up" your analysis, look at another informative summary plot. Plot the original series, forecasts, and residuals all in the same plot. Such a plot may reveal other "problems" with your ARIMA model, for example, if the residuals are particularly large, and the fit particularly poor in one region of the series (e.g., there may be a three-year period where the ARIMA model consistently predicts more international airline passengers than were observed). Because the values of the residuals and observed series (and forecasts) are not compatible (remember that the residuals pertain to the log-ed and twice differenced series, while the forecasts are generated in terms of the unmodified series), you need to click the Plot two var lists with different scales button on the Review series tab to display the Select variables for plot/spreadsheet dialog. Select as the first variable to plot, the original series with the forecasts added and as the second variable, select the ARIMA residuals.

Now click the OK button to see the graph.

Again, the fit of the ARIMA model seems very good; that is, the residuals show about equal variability across the entire length of the series, and there is no evidence of any trend or drift.
See also, Time Series Analysis Index.