QC Charts Example 3: Computing Chart Parameters for Different Sets
- Overview
- In this example it will be shown how you can base the computations of the different control chart parameters (center line, process sigma, control limits) on different subsets of samples and apply computed parameters to different subsets. We will use the same data file as in the first example (Cover.sta), but specify the chart for a different variable. For further explanations, see Example 1: Specifying Control Charts for Variables, Process Capability. Note that this example illustrates how to specify sets after the analysis (i.e., using options on the Sets tab of the Results dialog). You can also define sets prior to producing the charts, see Defining Variables - Sets tab for more information.
- Specifying the Analysis
- Open the data file Cover.sta via the File - Open Examples menu. Select Quality Control Charts from the Statistics - Industrial Statistics & Six Sigma submenu or from the Data Mining - Process Optimization - QC Charts submenu to display the
Quality Control Charts Startup Panel. Then select X-bar & R chart for variables on the
Quick tab (or the
Variables tab). Click the
Real-time tab and select the Auto-update option button. Now click the OK button to display the
Defining Variables for X-bar and R Chart dialog.
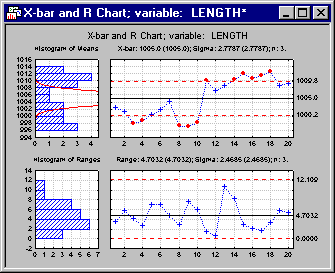
We will now create an X-bar & R chart for the variable Length in the data set. Click the Variables button on the Quick tab, select Length as the Variable with measurement and click OK. Select a value of 3 as the Constant sample size and as the Minimum number of observations per sample. Then click OK to produce the chart.
You will notice that, although the R chart seems to be in control, there are many outliers in the X-bar chart that need to be further examined.
- Setting up different sets
- Let us assume that we know for sure that the process was in control in the first ten samples. Beginning with sample 11 a machine has been replaced by a newer model. Therefore, we would like to specify two separate sets and perform the computation of the control chart parameters for each set independently (and determine whether the process might have shifted). The first set contains samples 1 - 10; the second set contains samples 11 - 20.
In the results dialog select the Sets tab and click the Make-a-new-Set Wizard button. In the resulting dialog, label the new set "In control" and click the Next button. Make sure that the option Range of consecutive samples is selected under Compute statistics from and click Next again. Specify the samples number 1 and 10 in the drop-down boxes From sample and To sample. Note that you could also click the Select range by dragging (on graph) button in order to select the range of samples in the brushing mode. Click Next, and in the next dialog choose the Range of consecutive samples option button under Apply statistics and specifications to and click Next. Again select samples 1 to samples 10 in the drop-down boxes From sample and To sample. Then click Finish.
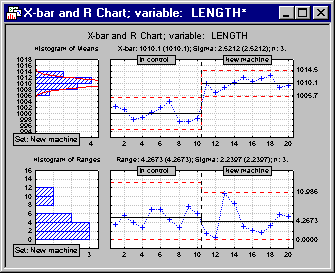
Specify a second set labeled "New machine" by using the procedure described above and selecting samples 11 to 20. When you are done, your control charts will have different sets of control limits and center lines for the two separate sets.
You can also have those different sets labeled in the graph. Click the Options button in the Results dialog, select the Layout tab in the Options dialog, select the check box Identify sets of samples (with different specs) in the chart, and click OK.
By inspecting the X-bar chart, you can conclude that the process might indeed have shifted when the new machine was introduced. However, each set by itself seems to be in control (i.e., there are no out-of-control conditions present).
- Reviewing summary information for different sets
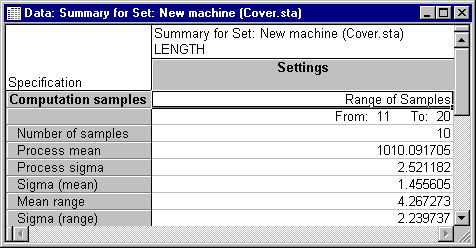
- Finally, you can look at spreadsheets that contain the chart parameters for each individual set that you created and for the "remainder set" called All Samples. Click the Summary specifications for all sets button on the
Sets tab. Shown below is part of the spreadsheet for the set New Machine.
Note: the assignment of samples to sets proceeds hierarchically; i.e., a sample is assigned to the first set (beginning with the last set that was specified) where it "fits." Because you have assigned all samples in your data file to individual sets, there are no samples left that could be assigned to the "remainder" All Samples. Thus, the spreadsheet for the All Samples set does not contain any value for the mean of application samples (simply because there are no samples left that have been uniquely attributed to this set).
In order to remove the sets, select them in the Set field on the Sets tab and click the Delete button.
It is not absolutely necessary that the samples on which the computations for center line and control limits are based be the same as those to which those computations apply as in our example. We could have easily specified that the control limits and center line computed from the first set (where the process was in control) should be applied to all samples. Thus, you could determine whether the process is still in control if you use only the control chart parameters that were established for the first set.
See also QC Chart Examples.


