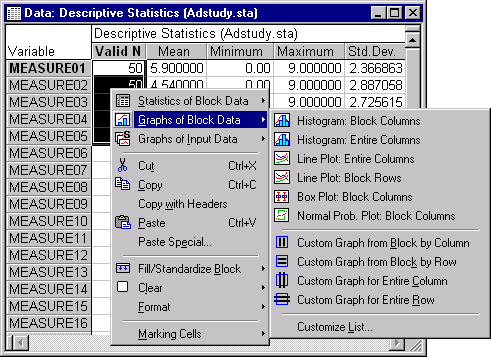
Graphs of Block Data
Unlike Graphs of Input Data, Graphs of Block Data use the currently selected (continuous) block of data in the active spreadsheet to specify input data for the graph.
Although the most convenient (and you could say most logical) way to select Graphs of Block Data is via the shortcut menu associated with the respective block selected in a spreadsheet, Graphs of Block Data are also available from the Graphs menu or the STATISTICA Start button
![]() menu. When creating Graphs of Block Data, you can select from default graphs (e.g.,
Histogram: Block Columns or Line Plot: Block Rows), or you can create your own custom graphs for either the selected cells in the rows or columns or of all cells in the selected rows or columns (i.e., going beyond the values that are selected in the block).
menu. When creating Graphs of Block Data, you can select from default graphs (e.g.,
Histogram: Block Columns or Line Plot: Block Rows), or you can create your own custom graphs for either the selected cells in the rows or columns or of all cells in the selected rows or columns (i.e., going beyond the values that are selected in the block).
- Default graphs
- The default graphs (the first six commands in the illustration above) allow you to create specified graphs with a single click. For specific information on default graphs, click on a link below.
- Custom graphs
- Select one of the four custom graph options to display the
Select Graph dialog box, which provides a variety of options for creating customized graphs.
For specific information on a custom graph, click on the graph name below.
 Custom Graph from Block by Column
 Custom Graph for Entire Column
 Custom Graph from Block by Row
 Custom Graph for Entire Row
Customizing Graphs. As with most features of STATISTICA, Graphs of Block Data are fully customizable. Select Customize List from the Graphs of Block Data menu to display the Customize Graph Menu dialog box, which provides options to remove, rename, or edit the currently listed graphs as well as to add new (user-defined) graphs to the Graphs of Block Data menu.
For example, if you want to include a normal fit on the histograms created using Histogram: Block Columns, select Histogram: Block Columns in the Customize Graph Menu dialog box, click the Edit button, and switch the Graph SubType to Normal Fit. All subsequently created Histogram: Block Columns plots will include a normal fit to the data.


