Example 3: Changing the Chart Specifications from Inside Event Handlers
Example 1 illustrates how to set up the basic connection between a custom event handler and the chart. One of the unique capabilities of the Statistica Quality Control Charts module is the full programmability of all chart specifications via Statistica Visual Basic. For example, you can update the chart specifications dynamically and automatically, as the data stream changes, or based on some sophisticated computational analyses of related data (e.g., via Neural Networks that "learn" when problems are likely to occur in the future; see also Example 4, where a simple statistical analysis is performed inside the event handler). Here is an example.
Create a new data set with 20 or so cases (observations) and 1 variable. Do not enter any data yet, but create an X and MR (moving range) chart for individual observations for the empty data set. Also make sure that you select the auto-update mode of operation on the Real Time tab of the Quality Control Charts Startup Panel. Next create and connect a custom event sink for the (auto-) update event.
'Events
Option Base 1
' We will use the statistical functions available
' in the Statistica library of matrix and math
' functions; therefore include the header file STB.svx:
'$include: "*STB.svx"
Private Sub SourceObj_OnUpdate( _
ByVal Obj As Object, _
ByVal SampleIDFrom As String, _
ByVal PartIDFrom As String, _
ByVal SampleIDTo As String, _
ByVal PartIDTo As String)
Dim ss As Spreadsheet
' NOTE: Input argument Obj is the current results dialog, which for all
' Shewhart control charts is a QuaShewhartChartResults object. Via this
' dialog, all chart specifications can be set.
Dim gg As QuaShewhartChartResults
Set gg=Obj
Set ss=ActiveDataSet
Dim var As Integer
Dim i As Integer, n As Long
ReDim xx(10) As Double
var=1
n=1
For i=1 To ss.NumberOfCases
If (ss.MissingData(i,var)=False) Then
' If there are more than 10 valid observations, we exit
' the update handler; only when there are exactly 10 cases
' will we proceed to set the chart statistics.
If (n>10) Then Exit Sub
xx(n)=ss.Value(i,var)
n=n+1
End If
Next i
' Compute and set the chart statistics.
Dim mu As Double, sig As Double
ValMedian(xx,1,n,mu)
ValStDeviation(xx,1,n,sig)
' Set the centerline value and sigma value for the
' chart to a user defined value, as computed by
' the ValMedian and ValStDeviation functions.
gg.CenterValue = "UserDefined "+Str(mu)
gg.SigmaValue = "UserDefined "+Str(sig)
End Sub
Now start typing in some data. You will see that the basic chart statistics are set to user defined values after you entered the value for the 10'th observation (the center line value is computed as the median, sigma is estimated from the simple standard deviation).
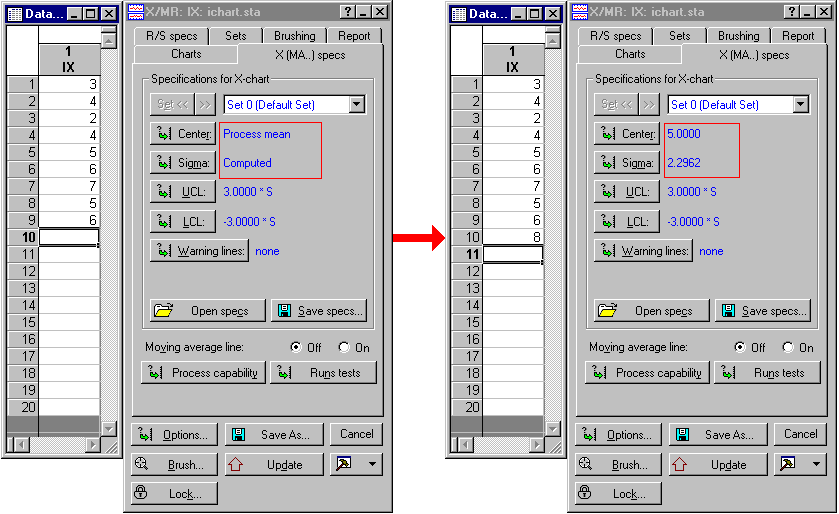
After the 10'th observation, these values are not changed again. This method of determining the chart specifications can be very useful when you want to determine the chart specifications algorithmically and automatically for many variables, without requiring any intervention (of course, Statistica Visual Basic also allows you to program complete user interfaces that you can integrate in your programs).