Interactive Trees (C&RT, CHAID) Example
The main purpose of the Interactive Trees (C&RT, CHAID) module is to provide interactivity and complete control over the tree-building process (see the Introductory Overview). Therefore, you may want to review the examples for the General Classification and Regression Trees (GC&RT), General CHAID (GCHAID) Models, and Classification Trees modules, and repeat the analyses described there using the Interactive Trees (C&RT, CHAID) facilities. You can then perform various "what-if" analyses, change particular branches in the results trees, etc., to assess how "unique" the respective solutions are, or how easy or difficult it is to "manually" derive trees of similar predictive validity, but with different split variables. We will demonstrate this process in this example, using the Poverty data set that is described, for example, in Example 2 in General Classification and Regression Trees (GC&RT).
Regression Tree for Predicting Poverty
This example is based on a re-analysis of the data presented in Example 1: Standard Regression Analysis for the Multiple Regression module and GC&RT Example 2: Regression Tree for Predicting Poverty. It demonstrates how regression trees can sometimes create very simple and interpretable solutions. In Example 2 of the General Classification and Regression Trees (GC&RT) module, we automatically built the tree shown in the following illustration:
The solution is relatively simple and straightforward. However, we want to build a tree that is even simpler, in particular with respect to the specific cut-off or split values for each predictor. In practice, it is often convenient to use split values that are simple to communicate (e.g., explain to management) and "administer" (e.g., if PT_PHONE < 50% then ..., instead of if PT_PHONE < 72% then...), especially when such simplicity can be achieved with little loss in the quality of the overall predictive model.
- Data file
- The example is based on the data file Poverty.sta. Open this data file via the File - Open Examples menu; it is in the Datasets folder. The data are based on a comparison of 1960 and 1970 Census figures for a random selection of 30 counties. The names of the counties were entered as case names.
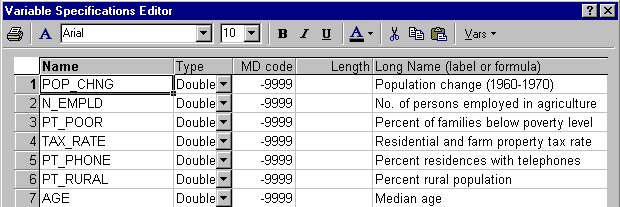
The following information for each variable is displayed in the Variable Specifications Editor (accessible by selecting All Variable Specs from the Data menu).
- Research question
- The purpose of the study is to analyze the correlates of poverty, that is, the variables that best predict the percent of families below the poverty line in a county. Thus, you will treat variable 3 (Pt_Poor) as the dependent or criterion variable, and all other variables as the independent or predictor variables.
- Setting up the analysis
- Select Interactive Trees (C&RT, CHAID) from the Data Mining menu to display the
Interactive Trees Startup Panel. Begin the analysis by specifying a classification and regression analysis (C&RT). On the
Interactive Trees Startup Panel - Quick tab, select Regression Analysis from the Type of analysis list (since Poverty is a continuous variable). For the Model building method, select C&RT.
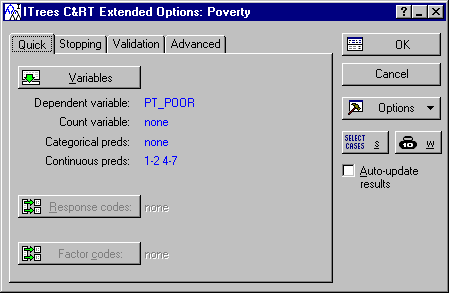
Click the OK button to display the Interactive Trees Specifications dialog box (in this case, the ITrees C&RT Extended Options dialog box). Next, click the Variables button and select PT_POOR as the dependent variable and all others as the continuous predictor variables, and click the OK button.
Click OK in the ITrees C&RT Extended Options dialog box to begin the analysis and to display the ITrees Results dialog box.
Manually Building the Tree
The Interactive Trees (C&RT, CHAID) module doesn't build trees by default, so when you first display the Itrees Results dialog, no tree will have been built (if you click the Tree graph button at this point, a single box will be displayed with a single root node).
- Reviewing predictor statistics
- Let's first review the initial predictor statistics. On the Itrees Results dialog - Manager tab, click the Predictor stats button.
- Selecting a split
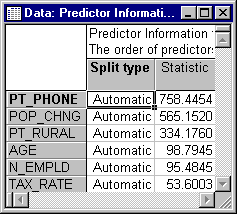
- This results spreadsheet shows the split statistics for the initial (Node 1) split; since this is a regression-type problem with a continuous dependent variable, the statistic shown is the sums-of-squares accounted for (explained) by the proposed split. Clearly, variable PT_PHONE (percent of residences with telephones) is the best (initial) predictor. To see what specific automatic split the program "proposes," click the Customize splits button on the
Itrees Results dialog - Manager tab.
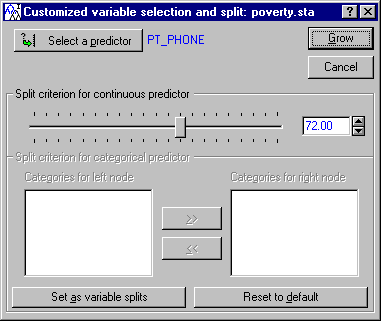
By default, the best split for variable PT_PHONE would be at value 72.00, i.e., at 72% (of households with telephones). To simplify the final interpretation of the tree, let's round this value up to 75% (i.e., "if three-quarters or more of the households have telephones, then..."), i.e., set the Split criterion for continuous predictor to 75. Then exit the dialog by clicking the Grow button.
- Reviewing the tree in the tree workbook browser
- We will review the current tree via the Tree browser option, however, we also want to see the observed distributions of values. So, first select the
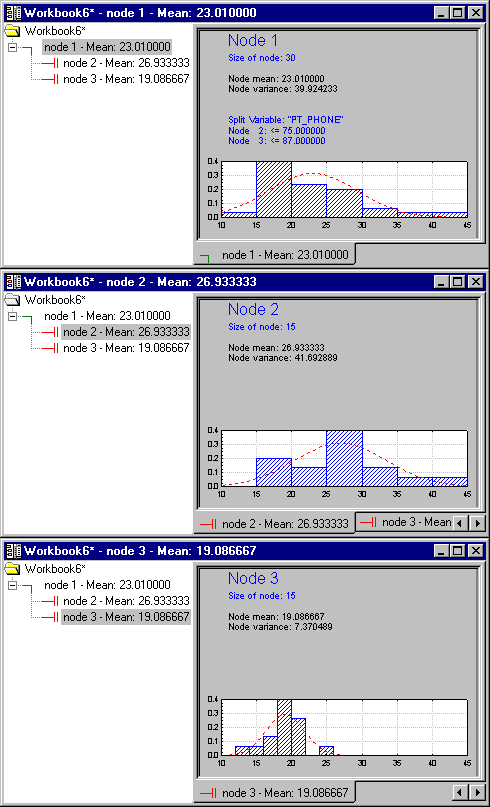
ITrees Results dialog - Summary tab, select the Display histogram of response in Tree workbook check box, and then click the Tree browser button.
One of the useful features of the workbook tree browser (see also, Reviewing Large Trees: Unique Analysis Management Tools) is the ability to review "animations" of the final solution. Start by highlighting (clicking on) Node 1. Then use the arrow keys on your keyboard to move down the nodes of the tree. You can clearly see how the consecutive splits produce nodes of increasing purity, i.e., homogeneity of responses as indicated by the smaller standard deviation of the normal curve.
Automatically Growing (Completing) the Tree, Brushing the Tree
Now let's finalize the tree by automatically growing the tree to the final "stopping-point," consistent with the stopping criteria we accepted (by default) on the Interactive Trees Specifications dialog - Stopping tab; let's also use the tree-brushing tools for this purpose.
On the Itrees Results dialog - Manager tab, click the Brush tree button. If you selected (or didn't change the defaults) to display the results in a workbook, then the current tree will be displayed as a scrollable graph in the default output workbook.
Also, the Brushing Commands dialog is displayed. You can select any of the options and return to the tree brushing user interface to review the results (e.g., if you grow or prune the tree); note that the same options are also available on the shortcut menu, accessible by right-clicking on the brushing (cross-hair) cursor.
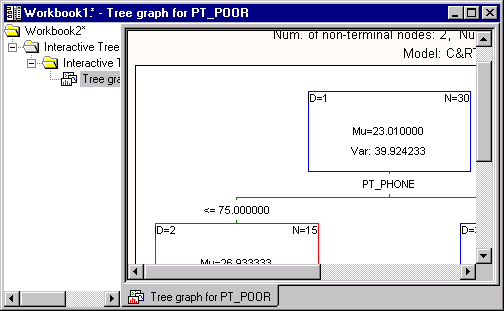
Now click the Grow tree button to automatically "finish" the tree. Shown below is the final, automatically grown tree.
As you can see, the program split once more on the same variable PT_PHONE.
Modifying a Branch of the Tree
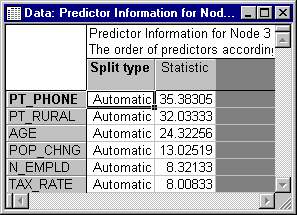
To see what other variable may have provided a good split at node ID=3, click the Brush tree button again, select node number 3, and then click the Predictor statistics button; note that in the tree brushing mode, the results spreadsheet will automatically be created in a stand-alone window, which you can position (and update) in a convenient place on the screen. After this spreadsheet is displayed, the program will automatically return to the tree brushing mode so you can select additional statistics and tree growing/pruning operations.
It appears that variable PT_RURAL (Percent of rural population) may provide a split of similar "quality" as did the (automatically chosen) split on variable PT_PHONE. To make the split based on variable PT_RURAL, select node ID=3 (if it is not highlighted/selected already), and then click the Custom splits button.
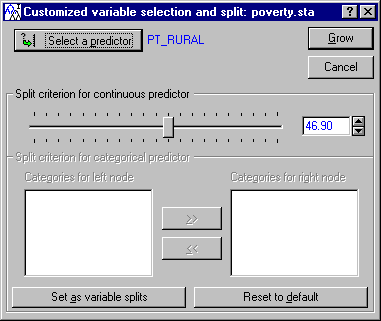
This will display the Customized variable selection and split dialog. In this dialog, click the Select a predictor button and select predictor PT_RURAL as the predictor for this split.
Now click Grow to return to the tree brushing user interface.
Now Cancel the tree brushing mode, and return to the ITrees Results dialog.
Conclusion and Comparisons
You could now compare the goodness of fit of this tree with the tree that is generated automatically by the program. For example, you could simply start another identical analysis using the Interactive Trees (C&RT, CHAID) module, and grow the tree without changing any of the automatic splits. The tree that is built automatically will only involve variable PT_PHONE, with a slightly different split at node 1. When you use the Risk estimate option on the Trees Results dialog - Summary tab, you will see that the automatically grown tree is indeed better than the one we built "by hand." That is to be expected and not unusual, given that the automatic tree building methods will always look for the maximum improvement in the overall model fit at each split.
However, by "manually" building and exploring a trees you can often gain better insights into your data, identify alternative important predictors (other than those chosen automatically by the program), and accommodate practical constraints regarding which predictor variables can be accurately and economically measured when predicting new observations. For example, some predictors that are automatically chosen by the program may not be readily observable in the real world, such as information about a person's Income. This data may not be easily obtained even if analyses of historical data show that variable to be an important predictor. In this case, you may want to manually exclude splits on variable Income during model building, since as a practical matter, that information is not available for predicting new cases.
- Comparing results to GC&RT Example 2: Regression Tree for Predicting Poverty
- You will notice that the results in this example are notably different from those produced in
GC&RT Example 2: Regression Tree for Predicting Poverty (as shown at the beginning of this example). This is to be expected, given 1) in general, the differences in computational procedures (as also described in
Differences in Computational Procedures in the
Introductory Overview), and 2) that the v-fold cross-validation option for the entire tree sequence was used in GC&RT Example 2 to derive a "stable" (valid) tree.
To reiterate, tree-building techniques are heuristic algorithms and while valuable insights and useful predictive models can often be derived, they are not necessarily the "only" unique models for the given data.


