Example 8: Setting Up Dashboards
Dashboards require the Statistica Monitoring and Alerting Server (MAS). MAS is an application that is available as an add-on to Statistica Enterprise. It enables you to monitor groups of Analysis Configurations for alarms and other specified conditions, and to designate what actions will be taken when those alarms or specified conditions are detected. This approach allows for the efficient and automated server-based analytic monitoring of specific data streams using SVB or IQC (Interactive Quality Control) Analysis Configurations. The underlying Analysis Conditions can specify any analysis to run in Statistica. For purposes of this example, the focus will be on Quality Control analyses, where the definition of alarms is defined in the Alarm Options of the IQC Analysis Configuration. For SVB Analysis Configurations, the approach is the same, except that the Statistica Visual Basic (SVB) script will need to have specific return codes designating the specific outcomes for MAS to monitor.
The 2 main components of MAS are Tasksets and Dashboards:
A Taskset is a collection of one or more related Analysis Configurations. Rules for handling alarms are specified in a Taskset.
A Dashboard is a visual representation of one or more Analysis Configurations that have been placed into Tasksets. Dashboards enable you to see whether a given analysis has generated an alarm.
Dashboards require that Server TaskSets are configured to define the automated monitoring to be performed by the Statistica Server(s). See the Server Task Set example for details.
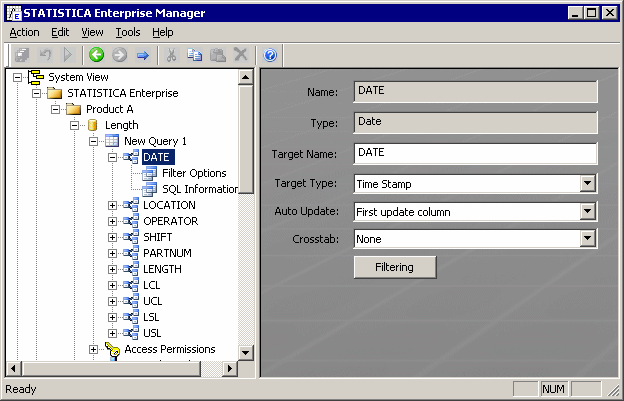
You can create a dashboard from the data configuration created in Example 4: Setting up a Data Configuration. The data configurations must contain Auto-Update fields like the DATE field below.
To begin creating a Dashboard, right-click on a node in the System View tree and select New Dashboard.
A new Dashboard node is created in the tree view on the left, and the details of that Dashboard's components are displayed in the properties page on the right.
In the Name field, enter Last Stage. Verify that the In use check box is selected.
Click the Add Row button. A new row node will be created in the tree view, and the details of that row will be displayed in the properties page.
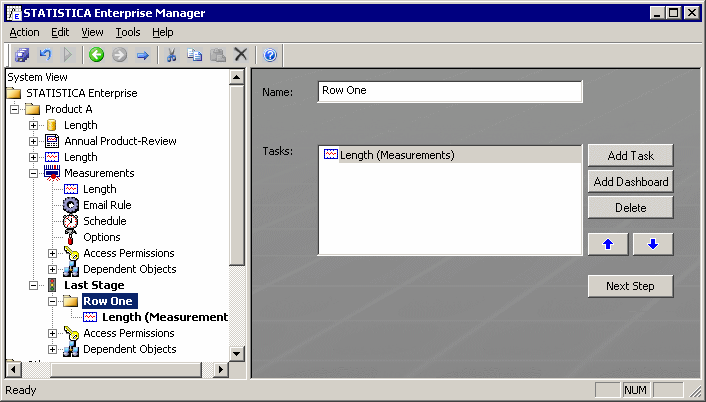
In the Name field, type Row One.
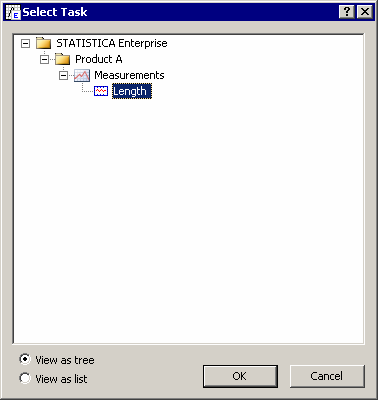
Click the Add Task button. A dialog box is displayed where you can select a task to add to the row. Note that you can only select from among the tasks that are contained in a Taskset.
Select a task and click OK.
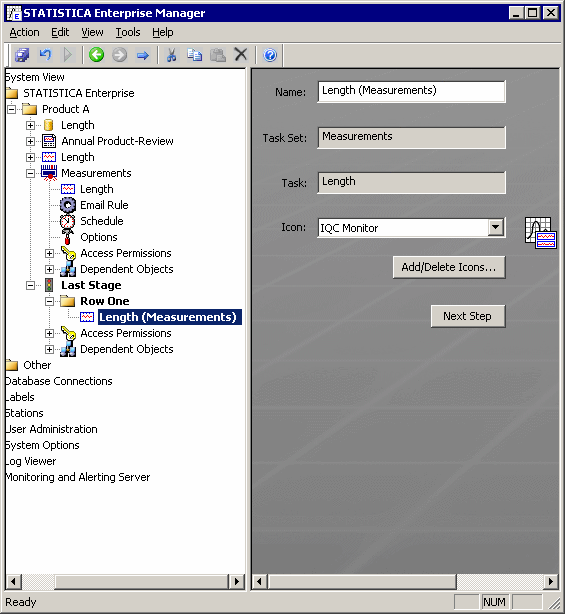
A new task node will be created in the tree view, and the details of that task will be displayed in the properties page.
In the tree view, select the Row One node.
The Tasks list box will contain the selected task. You can add another task by clicking Add Task, or you can delete the existing task by selecting it and then clicking Delete Task. If there are 2 or more tasks in the list box, you can use the arrow buttons to rearrange the order of the tasks in the list box.
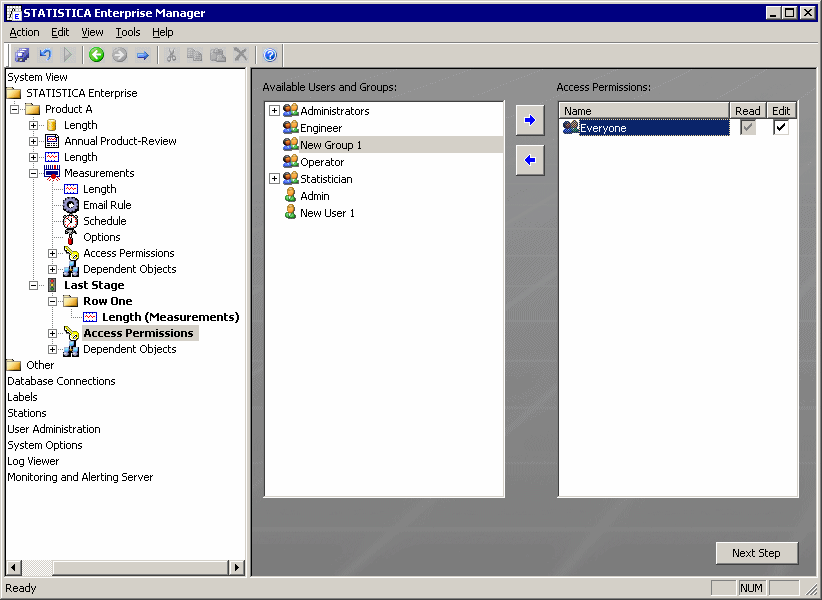
In the tree view, select the Access Permissions node.
In the Available Users and Groups list box, select Everyone. Click the right-pointing arrow. The Everyone group will move to the Access Permissions list box. Select the Edit check box for the Everyone group. Now everyone has permissions to read and edit this Dashboard.
We have now finished creating the Last Stage Dashboard. From the Action menu, select Commit Changes, or press CTRL+S on your keyboard, or click the Commit Changes button on the toolbar to save this Dashboard.
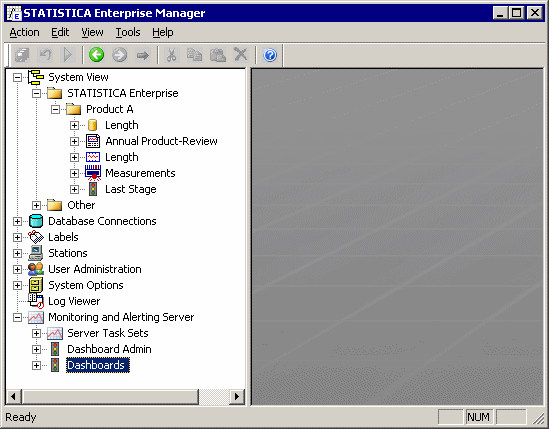
Monitoring and Alerting Server Tree View
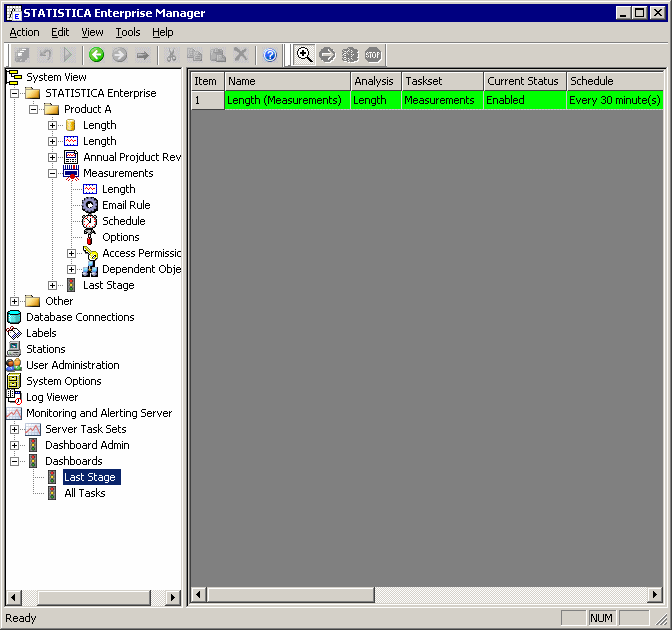
In the tree view, the last root node is named Monitoring and Alerting Server. Expand that node.
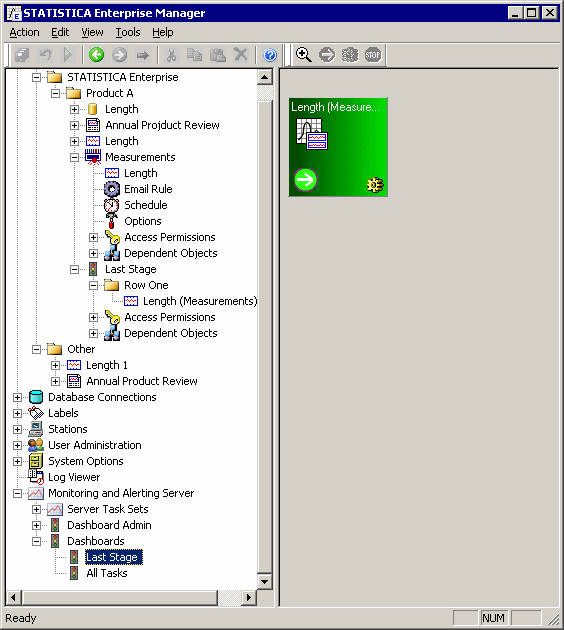
Expand the Dashboards node, and select the Last Stage node.
The Dashboard display enables you to monitor the task(s) in the Dashboard. The task(s) will run according to the schedule specified in the Taskset.
While the task is running, the gear icon at the lower-right will be replaced by a small running stick figure.
When the task has completed, the gear icon will reappear.
If the box changes to red, it indicates that an alarm has been generated.
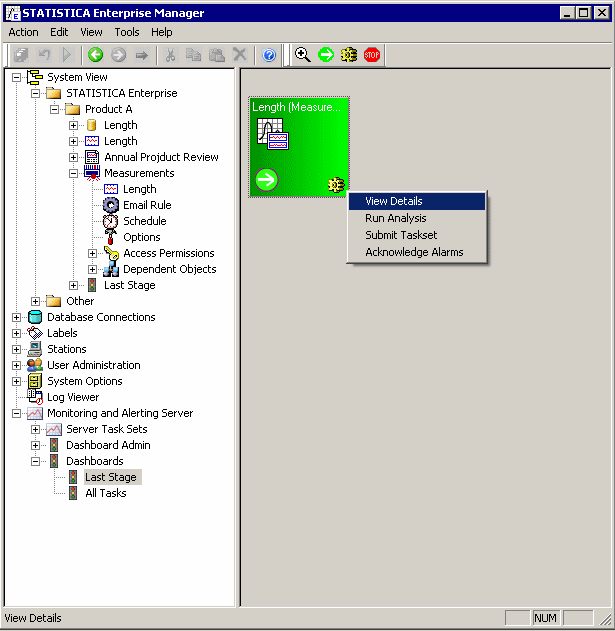
You can view the details of the latest run by right-clicking on the box and selecting View Details from the shortcut menu.
Then the detailed view will be displayed.
You can close the detailed view by right-clicking and then de-selecting View Details.
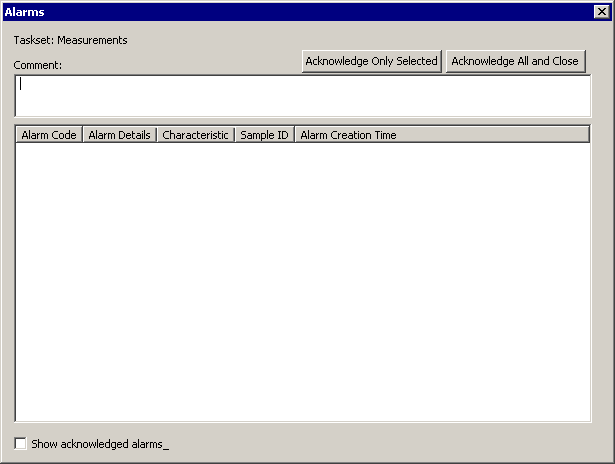
You can acknowledge an alarm by right-clicking on the box and selecting Acknowledge Alarms.
The Alarms dialog box will be displayed, where you can acknowledge the alarm(s) listed.
If you have several alarms listed, you can select individual alarms to acknowledge and click the Acknowledge Only Selected button. To acknowledge all alarms, click the Acknowledge All and Close button. The Alarms dialog will close, and the red alarm image in the Dashboard will change back to green.
You can manually schedule the task to run immediately by clicking on the small gear icon in the lower-right corner of the box.
You can display the control chart for the task by clicking on the small arrow icon in the lower-left corner of the box.

