Example 18: Testing the Equality of Correlation Matrices from Different Populations
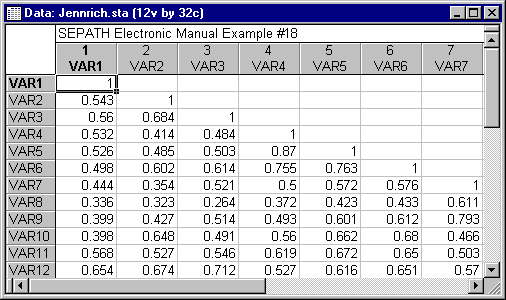
Structural Equation Modeling (SEPATH) can perform correlational pattern hypothesis tests either between or within samples (or both). In this example, using the Jennrich.sta data file, we show you how to use SEPATH to compare correlations in two or more populations for equality. Open this file via the File - Open Examples menu. Part of that file is shown below.
The general procedure for comparing two or more correlation matrices for equality is extremely straightforward. In general, you specify all the off-diagonal elements of the correlation matrix as free parameters, then copy the identical model for as many groups as you want to compare.
Select Structural Equation Modeling from the Statistics - Advanced Linear\Nonlinear Models menu. In the resulting Structural Equation Modeling dialog click on the Advanced tab. Click the Set parameters button and select Correlations under Data to analyze on the Analysis Parameters dialog. Before setting up your model file, you will have to enter the appropriate group selection commands. Click the Specify groups button to display the Specify Grouping Variables dialog and enter 2. Once you have specified the groups you want to compare, set up your model file using the following approach.
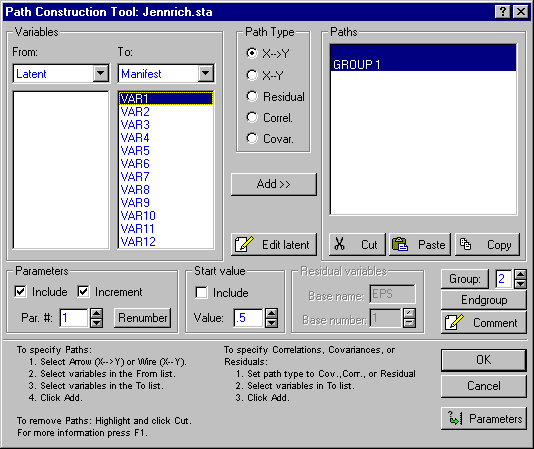
(1) Click the Path tool button and in the Path Construction Tool dialog, enter the GROUP 1 command by clicking the Group button.
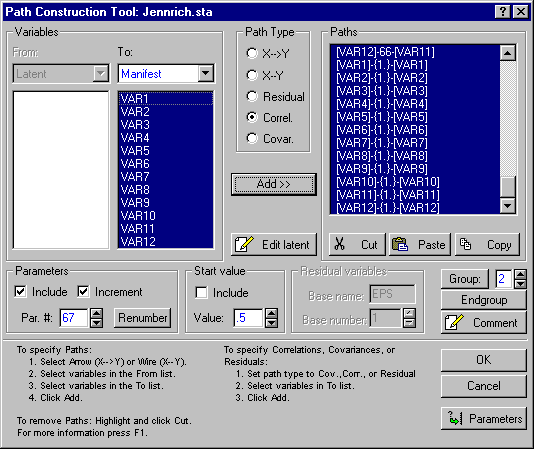
(2) Select Correl. under Path Type, select Manifest in the To: column under Variables, and highlight all the variables for the correlation matrix to be tested. Then click the Add>> button.
(3) Add an ENDGROUP command by clicking the Endgroup button.
(4) Highlight the commands that specify the entire correlation matrix (all but GROUP 1 and ENDGROUP). Copy them to the Clipboard by clicking the Copy button.
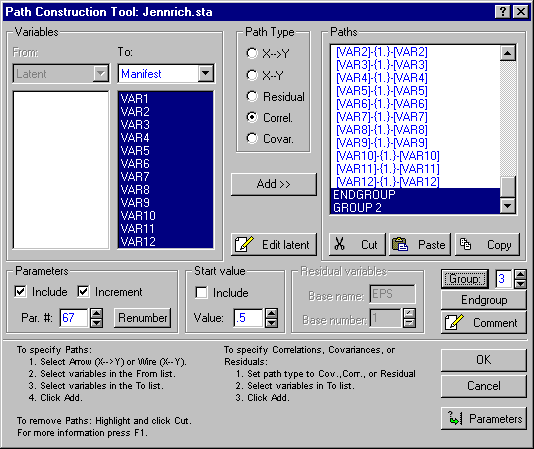
(5) Then for each group, add a GROUP command by clicking the Group button. In this case, we will add only a second group.
(6) Then paste in a copy of the correlation matrix commands after the GROUP 2 command by clicking the Paste button, and add another ENDGROUP command by clicking the Endgroup button.
(7) Finally, click OK to save the model.
The example described here is taken from an article by Jennrich (1970). In the article, Jennrich describes a "dedicated" procedure for comparing two correlation matrices. His procedure, based on the method of generalized least squares, is somewhat different from the method employed by SEPATH. Jennrich gives an example in which two groups of subjects (40 mentally handicapped, 89 normal), are both measured on 12 variables. The correlation matrices are then compared for equality.
The commands for comparing the two matrices for equality are in the file Jennrich.cmd (also found in the /Examples/Datasets/SEPATH directory of STATISTICA).
Jennrich (1970) compares GLS and ML test statistics for this problem. Try running the example with the GLS discrepancy function, then with the ML discrepancy function (by clicking the Set parameters button and selecting these on the Analysis Parameters dialog). You will find that the GLS statistic with 66 degrees of freedom fails to reject at the .05 level of significance (Chi-square = 56.27, p =.7977), while the ML statistic does reject (Chi-square = 102.25, p = .0028). Depending on one's theoretical predisposition, one might be tempted to accept one result or the other as the "right" one in this case. However, such a judgment might be ill-advised and statistically naive. There are several possible reasons for these conflicting results. The ML test may be more powerful than the GLS procedure. From another standpoint, both procedures are asymptotic tests, and their exact sampling distributions are not known. It may be, therefore, that the ML procedure is more liberal at small to moderate sample sizes. That is, it may be that the ML procedure rejects too often at small sample sizes.
Hardly any information is available in the literature about the performance of correlational pattern hypothesis tests for comparisons across populations. (Steiger (1980b) presents some evidence in single sample tests that the ML test may be more liberal than the GLS test at small samples, and hence may tend to reject a true null hypothesis too often.) However, the interested experimenter may generate some evidence on his/her own by using SEPATH's powerful Monte Carlo analysis.


