Spreadsheet (Multimedia Table) Overview
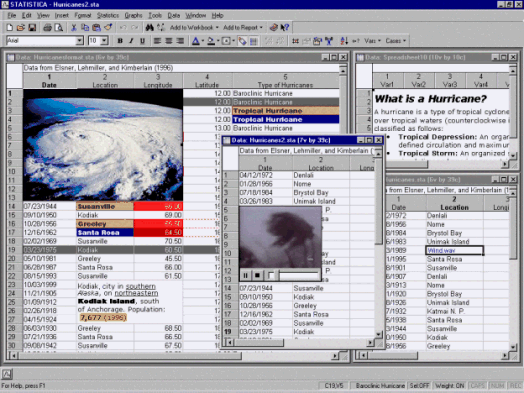
Statistica Spreadsheets are based on proprietary multimedia table technology in Statistica and are used to manage both input data and the numeric or text (and optionally any other type of) output.
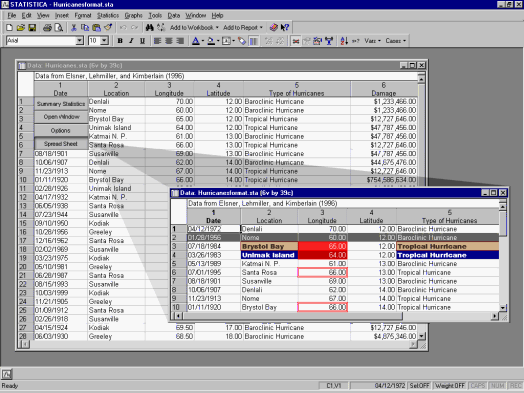
The basic form of the spreadsheet is a simple two-dimensional table that can handle a practically unlimited number of cases (rows) and variables (columns), and each cell can contain a virtually unlimited number of characters. Sound, video, graphs, animations, reports with embedded objects, or any ActiveX compatible documents can also be attached.
Because Statistica Spreadsheets can also contain macros and any user-defined user interface, these multimedia tables can be used as a framework for custom applications (such as with a list box of options or a series of buttons placed in the upper left corner), self-running presentations, animations, simulations.
As mentioned in the Dataset Terminology topic, Statistica data are organized into cases and variables. If you are unfamiliar with this notation, you can think of cases as the equivalent of records in a database management program (or rows of a spreadsheet), and variables as the equivalent of fields (or columns of a spreadsheet). Each case consists of a set of values of variables, and the first column in the file can (optionally) contain names of cases.
See Spreadsheet (Multimedia Table) Window Overview for more information about the components of the spreadsheet window. See also, Formatting Options, Data Types, Multiple Analysis Support, Unlimited Size of Spreadsheets, and What are the drag-and-drop facilities?.


