QC Charts Example 1: Specifying Control Charts for Variables, Process Capability
- Overview
- This example demonstrates how to specify control charts for variables in the Quality Control Charts module. It is based on the Cover.sta data file. Open this data file via the File - Open Examples menu; it is in the Datasets folder.
Let's assume that we are manufacturing plastic cover plates that have to be integrated into an instrument panel. The width and the length (both measured in millimeters) are important quality characteristics, since the cover has to fit into a predefined frame. We will first use an X-bar and R chart in order to monitor the width. At a later point we will create a control chart for the length. Overall we have collected 20 samples of 3 observations each. Those data could have come directly from a measurement device or from a database.
- Specifying the Analysis
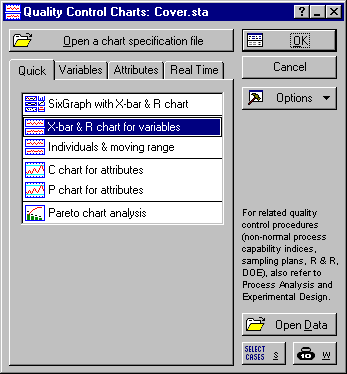
- Select Quality Control Charts from the Statistics - Industrial Statistics & Six Sigma submenu or from the Data Mining - Process Optimization - QC Charts submenu to display the
Quality Control Charts Startup Panel. Then select X-bar & R chart for variables on the
Quick tab (or the
Variables tab). Click the
Real-time tab and select the Auto-update option button. Now click the OK button.
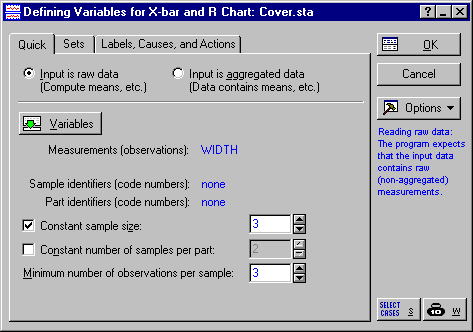
This will display the Defining Variables for X-bar & R Chart dialog. On the Quick tab, click the Variables button and select the variable Width as the Variable with measurements and click OK. Enter a value of 3 in the fields for Constant sample size and Minimum number of observations per sample. This will ensure that Statistica takes consecutive sets of three values and identifies them as belonging to the same sample. Note that the Quality Control module assumes that your data come from a measurement device or database that takes samples of constant size from the on-going production process. Therefore, specifying a sample identifier variable is optional.
- Reviewing the Charts
- Click OK to produce the chart and display the
Results dialog.
Note: the chart is displayed as a stand alone window because of the selection we made on the Real-time tab of the Startup Panel. We could have chosen to display it in a workbook instead.
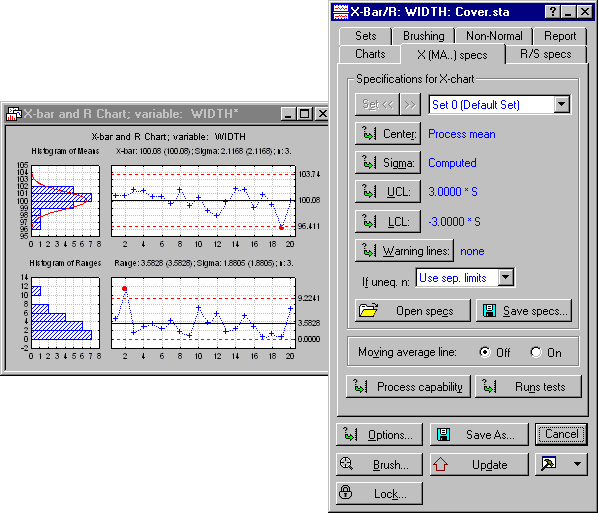
Statistica will produce a compound graph that consists of an X-bar chart in the upper part (for monitoring the process mean) and an R chart in the lower part (for monitoring process variation). Both charts are accompanied by histograms that display the distribution of the quality characteristics (sample means and ranges, respectively). The dialog to the right allows you to control different aspects of the control chart.
In general you need to ensure that the process variation is under control before you can evaluate whether the process is "on target." Therefore, we will inspect the control chart for the process variation (R chart in this case) first. You will notice that the second sample is out-of-control since the range for the second sample exceeds the upper control limit.
Now we turn to the X-bar chart. Here the 19th sample (not shown above) seems to be out-of-control as it falls below the lower control limit.
In order to check for non-random patterns of adjacent samples we check the runs rules tests. Click the Runs tests button on the Charts tab of the results dialog. This will perform runs rules tests with the default settings. If you would like to change the settings for the runs rules tests you can edit them by clicking the Runs tests button on the Specs tab of the results dialog to display the Runs Tests for Control Charts dialog.
When you click the Runs tests button on the Charts tab of the results dialog, Statistica will display two spreadsheets (one for the X-bar chart, one for the R chart). Both spreadsheets indicate no runs rules violation (all cell entries in the spreadsheet are OK).
- Process capability
- If we know that our engineering specifications (tolerances) are +/-10 millimeters around the target width of 100, we can use this information to perform process capability studies and have process capability indices displayed in the graph.
On the X (MA..)-specs tab click the Process capability button to display the Specifications for Capability Analysis dialog. Make sure the Type is Nominal+-delta, enter 100 in the field for Nominal and 10 in the field for Delta. Then click the OK (compute) button. Statistica will display two spreadsheets with process capability indices and process performance indices, respectively.
By inspecting the process capability indices, we can conclude that the process seems to be capable and centered overall (although we have out-of-control conditions). You can also request a process capability histogram by clicking the Histogram button under Process capability on the Charts tab.
Now, click the Options button on the Results dialog to display the Options dialog and select the Stats tab. Under Include (display) capability indices in graph, Normal select the check boxes for Cp, Cr, Cpl, Cpu, and Cpk. Then click OK. The graph will be updated and show the process capability indices in the upper left corner.
Note: you can also have the engineering specifications (upper and lower spec limit) displayed in the X-bar chart. Click the Options button and select the Show process specifications and specification limits in chart check box on the Layout tab.See also QC Chart Examples.


