Example 1: Pattern Recognition (Classification of Digits)
This example illustrates the use of classification trees for pattern recognition. This example data set is also discussed in the context of the Classification Trees Analysis module (see Example 1: Discriminant-Based Splits for Categorical Predictors).
The data for the analysis were generated in a manner similar to the way that a faulty calculator would display numerals on a digital display (for a description of how these data were generated, see Breiman et. al., 1984). The numerals from one through nine and zero that were entered on the keypad of a calculator formed the observed classes on the dependent variable Digit. There were 7 categorical predictors, Var1 through Var7. The levels on these categorical predictors (0 = absent; 1 = present) correspond to whether or not each of the 7 lines (3 horizontal and 4 vertical) on the digital display was illuminated when the numeral was entered on the calculator. The predictor variable to line correspondence is Var1 - top horizontal, Var2 - upper left vertical, Var3 - upper right vertical, Var4 - middle horizontal, Var5 - lower left vertical, Var6 - lower right vertical, and Var7 - bottom horizontal. The first 10 cases of the data set are shown below. The complete data set containing a total of 500 cases is available in the example data file Digit.sta. Open this data file via the File - Open Examples menu; it is in the Datasets folder.
- Specifying the Analysis
- With two exceptions (i.e., the specifications for Priors and V-fold for cross-validation), we will use the default analysis options in the
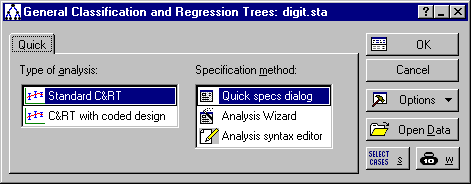
General Classification and Regression Trees Models (GC&RT) module. Select this option from the Data Mining menu to display the
Startup Panel.
We will perform a standard GC&RT analysis, so click the OK button to display the Standard C&RT Quick specs dialog. The dependent variable in this case is categorical in nature, so on the Quick tab, select the Categorical response (categorical dependent variable) check box. Then click the Variables button to display the standard variable selection dialog. Here, select Digit as the Dependent variable and Var1 through Var7 as the Categorical predictor variables, and then click the OK button. There is no need to specify the Factor codes or Response codes explicitly in this case since we will be using all of them, so STATISTICA will automatically determine those codes from the data.
Next, click on the Classification tab; we will accept most defaults here, i.e., Equal Misclassification costs and the Gini measure of Goodness of fit; however, select the Equal option button in the Prior probabilities group box. Then, click on the Validation tab, select the V-fold cross-validation check box, and accept all other defaults.
Finally, click OK to begin the computations. You will see a dialog to indicate the progress of the analyses; in particular the v-fold cross-validation analysis can be time consuming (as v repeated analyses are performed). Next, the GC&RT Results dialog will be displayed.
- Reviewing Results
- Select the
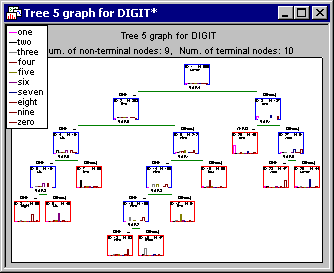
Summary tab, and click the Tree graph button to display the final tree chosen by the program (via v-fold cross-validation).
As is often the case, the final tree is a bit too large to display in a single graph; this is a common problem in this type of analysis (see also, General Computation Issues and Unique Solutions of STATISTICA C&RT in Introductory Overview - Basic Ideas Part II). You can of course use the standard graphics zooming tools to navigate the tree and to review specific "portions" or sections of the tree.
You can also click the Scrollable tree button on the GC&RT Results - Summary tab to review the tree in a scrollable window; in a sense, this option will create a much larger graph that can be scrolled "behind" the (scrollable and resizable) window.
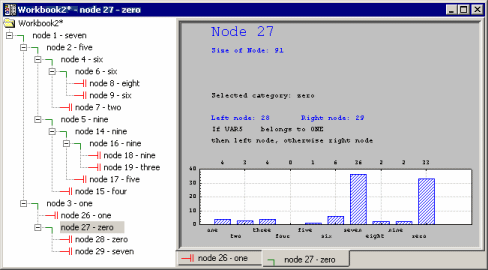
An alternative and often more efficient and informative facility to review large trees in STATISTICA is the Workbook Tree Browser, which enables you to navigate trees of practically unlimited size and complexity. Click the Tree browser button to display this tree browser.
The Workbook Tree Browser (see Reviewing Large Trees: Unique Analysis Management Tools in the Introductory Overview - Basic Ideas Part II) summarizes the tree as well as the split conditions and (classification) statistics for each splitting (intermediate) node (indicated by
 ) or terminal node (
 ). If you carefully review the tree you will see that the final classification is very good, yielding almost pure terminal nodes.
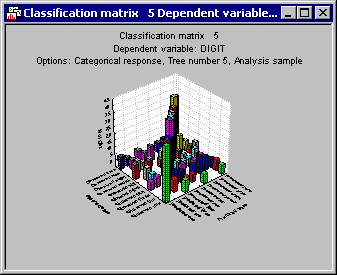
Return to the Results dialog, select the Classification tab, and click the Predicted vs. observed by classes button. This will produce a matrix of observed and predicted classifications, as well as a graphical summary of the predicted vs. observed classifications.
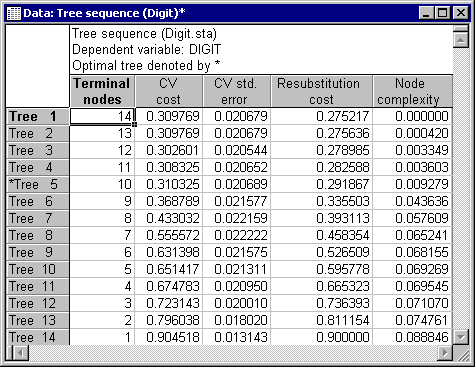
STATISTICA used v-fold cross-validation to select tree number 5 in the sequence of trees. Click the Tree sequence button on the Summary tab to display the Tree sequence spreadsheet.
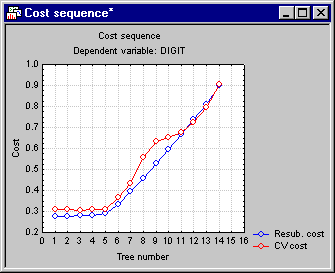
Tree number 5 is the least complex tree (least number of terminal nodes) with a cross-validation cost (CV cost) one standard deviation within the lowest CV cost (see the description of the Standard error rule on the Validation tab); hence it was selected as the "right-size" tree. Click the Cost sequence button to display these results in a graph.
Note how the Resubstitution cost for the sample from which the splits were determined increases as the pruning proceeds (note that as the tree number increases from 1 to 14, the number of terminal nodes decreases, i.e., consecutive tree numbers are increasingly "pruned-back"); this is to be expected since the fit for the data from which the tree was computed will become worse the fewer terminal nodes are included. However, interestingly, the CV (cross-validation sample) cost at first decreases, indicating that the trees number 1 through 4 actually "over-fitted" the data, i.e., produced results that were so specific to the sample from which the splits were computed, that they led to decreased prediction accuracy in the cross-validation samples (successive v-folds, i.e., randomly drawn cross-validation samples).
This example, further discussed in Breiman, et al. (1984) nicely demonstrates how v-fold cross-validation is an essential tool for determining the right-sized tree. In fact, without this tool, applied to all trees in the tree sequence, it is easy to overlook the best and most adequate solution (tree) for the data.


