GC&RT Results - Summary Tab
Select the Summary tab of the GC&RT Results dialog box to access options to review the main results of the C&RT analysis (classification). Note that by default Statistica initially selects the last (and usually most complex) tree that was computed, unless some of the cross-validation options were selected (see the Introductory Overview). Unless previously selected while specifying the current analysis, you can click the V-fold cross-validation & tree sequence button to perform the V-fold cross-validation to choose a best (right-size) tree.
- Tree view
- This group box contains the following options:
- Tree browser
- Click this button to produce a complete representation of the results tree in a Statistica workbook-like browser, where every node will be represented by a graph containing the respective split rule (unless the respective node is a terminal node) and various summary statistics. Intermediate and terminal nodes will be shown in the browser with different symbols:
This browser provides a complete summary of the results and, thus, you can efficiently review even the most complex trees (see also Reviewing Large Trees: Unique Analysis Management Tools in the GC&RT Introductory Overview - Basic Ideas Part II). However, the results displayed differ, depending upon whether the selected response variable was categorical or continuous.
Results for categorical dependent variable (classification). If you selected a categorical response variable (classification-type analysis; see the Introductory Overview), clicking on a node in the tree browser will produce a graph displaying the number of cases in each category of the variable as well as the histogram of statistics for the selected node.
Results for continuous dependent variable (regression). If you selected a continuous response variable (regression-type analysis; see the Introductory Overview ), clicking on a node in the tree browser will produce a graph displaying the mean and variance of the variable as well as the plot of normal density with these parameters for the selected node.
- Tree graph
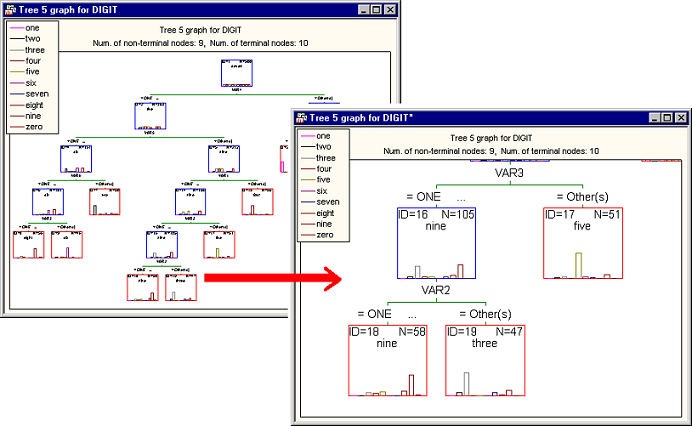
- Click this button to produce the Tree graph for the tree selected in the option Tree # (this tree was either selected by the user or via pruning or v-fold cross-validation). In this graph, each node will be presented as a rectangular box, where the terminal nodes are highlighted in red, and the intermediate nodes are highlighted in blue (by default). The following information is usually summarized in this graph: Node ID, the node size, the selected category of the response and the histogram (for classification-type problems) or the mean and variance at the node (for regression-type problems; see the
Introductory Overview). The graph also contains splitting information for the intermediate nodes: The splitting criterion that created its child nodes and the name of the predictor that was used in the splitting criterion. Note that all labels and legends for the graph are produced as custom text and can be moved, deleted or edited via graph properties dialogs accessible by right-clicking on the text and selecting options from the shortcut menu.
These tools allow you to review all details of large and complex tree graphs.
For reviewing large trees, you can also use the Scrollable Tree or Workbook Tree Browser facilities, which are particularly well suited for browsing the information contained in complex regression or classification trees.
- Tree layout
- Click this button to display the graph showing the structure of the tree selected in the Tree # edit field. Each node is presented as a rectangular box, where terminal nodes are highlighted in red, and non-terminal nodes are highlighted in blue.
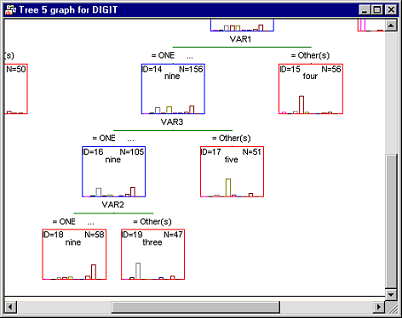
- Scrollable tree
- Click this button to display the same Tree graph, but in a scrollable window.
In a sense, this option will display a very large graph that can be reviewed (scrolled) behind a (resizable) window. Note that all standard graphics editing, zooming, etc. tools for customization and reviewing further details of the graph are still available for this method of display.
- All tree layouts
- Click this button to create tree structure graphs for all trees.
- Brush tree
- Click this button to brush large trees, i.e., to review the contents of different nodes in greater detail. After clicking this button, Statistica automatically finds the tree for brushing or creates a summary tree graph if none has been created yet. The crosshair tool
 is displayed along with the
Brushing Commands dialog box.
is displayed along with the
Brushing Commands dialog box.
If you move the crosshair over a node, a ToolTip pops up displaying detailed summary statistics for the respective node. To select a node, click it; you can then select the desired action for that node from the Brushing Commands dialog box or the shortcut menu, which contain identical options. For descriptions of the options available for each node, see the Node tab.
Exit the Brushing tree mode by clicking Cancel in the Brushing Commands dialog box.
- Tree structure
- Click this button to produce the Tree Structure spreadsheet, which contains the summary information of all splits and the terminal nodes for the final chosen tree. Regardless of the type of analysis problem (regression or classification analysis; see the Introductory Overview), the information available in the tree structure will include for each node:
- The node IDs of child nodes to which cases or objects are sent, depending on whether they satisfy (left branch), or do not satisfy (right branch) the split condition at a split node.
- The number of cases or objects belonging to the node.
- Information detailing the Split condition for a split node. Note that no child nodes or split conditions are displayed for the terminal nodes of the tree.
If you selected a categorical response variable (classification), then, in addition to the information described above the tree structure will include the number of cases or objects in each observed class that are sent to the node. Alternatively, in the case of a continuous response (regression) the tree structure will contain information about the mean and variance of the dependent variable for the cases or objects belonging to the node.
- Terminal nodes
- Click this button to produce a spreadsheet containing summary information for the terminal nodes only.
For classification problems (categorical dependent variable), the spreadsheet shows the number of cases or objects in each observed class that are sent to the node; a Gain value is also reported. By default (with Profit equal to 1.0 for each dependent variable class), the gain value is simply the total number of observations (cases) in the respective node. If separate Profit values are specified for each dependent variable class, then the Gain value is computed as the total profit (number of cases times respective profit values).
For regression problems (continuous dependent variable), the spreadsheet shows the number of cases or objects in each observed class that are sent to the node, and the respective node mean and variance.
- Tree sequence
- Click this button to produce a spreadsheet that contains the sequence of different trees that were considered during the analysis. Specifically, the following information is displayed, depending on the choice of stopping and/or pruning rule.
If you performed v-fold cross-validation to select a right-sized tree, the spreadsheet will contain the number of terminal nodes, the CV cost, its standard error, the resubstitution cost, and the node complexity for each pruned tree. However, if you did not opt for the v-fold cross-validation, the spreadsheet would still contain the number of terminal nodes, the resubstitution cost, and the node complexity for each pruned tree and omit CV cost and standard error. The pruned tree selected as the right-sized tree is marked with an asterisk.
If you selected FACT-style direct stopping as the Stopping rule for the analysis, the number of terminal nodes, the resubstitution cost, and the node complexity will be shown for the selected single tree.
- Cost sequence
- Click this button to produce the Cost Sequence line graph. If you performed v-fold cross-validation, then the line graphs of CV cost and the resubstitution cost will be produced for each pruned tree (see also the Introductory Overview and Computational Details). If you did not opt for v-fold cross-validation, then only the line graph of the resubstitution cost is produced for each pruned tree. If you selected FACT-style direct stopping as the Stopping rule for the analysis, then the CV cost and the resubstitution cost are displayed for the selected "right-sized" tree only.
- Importance
- Click the
 Importance button to produce a spreadsheet that contains the importance ranking on a 0-100 scale for each predictor variable in the analysis. Computational details regarding this measure can be found in Breiman (1984; p. 147). In general, the results presented in this spreadsheet enable you to judge the relative importance of each predictor variable for producing the final tree. Note that the concept of predictor
importance is related to the method of surrogate splitting (see the description of the
Advanced tab options for details), so it is possible for a variable to be important, even though it might not have been used for any split. Refer to the discussion in Breiman (1984) for details. See also,
Predictor Importance in Statistica GC&RT, Interactive Trees, and Boosted Trees.
Importance button to produce a spreadsheet that contains the importance ranking on a 0-100 scale for each predictor variable in the analysis. Computational details regarding this measure can be found in Breiman (1984; p. 147). In general, the results presented in this spreadsheet enable you to judge the relative importance of each predictor variable for producing the final tree. Note that the concept of predictor
importance is related to the method of surrogate splitting (see the description of the
Advanced tab options for details), so it is possible for a variable to be important, even though it might not have been used for any split. Refer to the discussion in Breiman (1984) for details. See also,
Predictor Importance in Statistica GC&RT, Interactive Trees, and Boosted Trees.
- Importance
- Click the
 Importance plot button to produce a bar graph that pictorially shows the importance ranking on a 0-100 scale for each predictor variable considered in the analysis. This plot can be used for visual inspection of the relative
importance of the predictor variables used in the analysis and, thus, helps in concluding as to which predictor variable is the most important predictor. See also,
Predictor Importance in Statistica GC&RT, Interactive Trees, and Boosted Trees.
Importance plot button to produce a bar graph that pictorially shows the importance ranking on a 0-100 scale for each predictor variable considered in the analysis. This plot can be used for visual inspection of the relative
importance of the predictor variables used in the analysis and, thus, helps in concluding as to which predictor variable is the most important predictor. See also,
Predictor Importance in Statistica GC&RT, Interactive Trees, and Boosted Trees.
- Design terms
- This option is only available if a coded (ANCOVA-like) design is specified (that option was chosen from the Startup Panel; see also Analyzing ANCOVA-like Designs in the General Classification and Regression Trees Overviews - Introductory - Overview Basic Ideas Part II). Click the Design terms button to display a spreadsheet of all the labels for each column in the design matrix (see also the GLM Introductory Overview). This spreadsheet enables you to unambiguously identify how the categorical predictors in the design were coded, that is, how the prediction model was parameterized. If in the current analysis the categorical predictor variables were coded according to the sigma-restricted parameterization (as requested via the respective option on the C&RT Quick specs dialog box - Advanced tab), this spreadsheet will show the two levels of the respective factors that were contrasted in each column of the design matrix; if the overparameterized model was used, then the spreadsheet will show the relationship of each level of the categorical predictors to the columns in the design matrix (and, hence, the respective parameter estimates).
- V-fold cross-validation & tree sequence
- Use the options (and the accompanying microscrolls) in the V-fold cross-validation & tree sequence group box to specify the settings for v-fold cross-validation, to select the right-size tree. Note that you can also specify these options on the
Quick specs dialog box or via the
Syntax Editor, in which case the v-fold cross-validation computations will already be completed, and clicking on this button displays a message informing you of this fact. Click the
Tree sequence button to review the results for each tree, and to see which tree in the tree sequence was selected via v-fold cross-validation.
Specifications for v-fold cross-validation include: Seed for random number generator, V-fold cross-validation; v-value, and Standard error rule. These values will be used to control the sampling that Statistica performs to obtain cross-validation error estimates. See also the Introductory Overview for details.
- Seed for random number generator
- The positive integer value entered in this box is used as the seed for a random number generator that produces v-fold random subsamples from the learning sample to test the predictive accuracy of the computed classification trees.
- V-fold cross-validation; v-value
- The value entered in this box determines the number of cross-validation samples that will be generated from the learning sample to provide an estimate of the CV cost for each classification tree in the tree sequence. See also the Introductory Overview for details.
- Standard error rule
- If a pruning method is selected in the Stopping rule group box, i.e., the
Prune on misclassification error,
Prune on deviance, or
Prune on variance option button is selected, then the value entered in the
Standard error rule box is used in the selection of the right-sized classification tree from the sequence of pruned trees after v-fold cross-validation.
The Standard error rule is applied as follows. Find the pruned tree in the tree sequence with the smallest CV cost. Call this value Min. CV, and call the standard error of the CV cost for this tree Min. Standard error. Then select as the right-sized tree the pruned tree in the tree sequence with the fewest terminal nodes that has a CV cost no greater than Min. CV plus the Standard error rule times Min. Standard error. A smaller (closer to zero) value for the Standard error rule generally results in the selection of a right-sized tree that is only slightly simpler (in terms of the number of terminal nodes) than the minimum CV cost tree. A larger (much greater than zero) value for the Standard error rule generally results in the selection of a right-sized tree that is much simpler (in terms of the number of terminal nodes) than the minimum CV cost tree. Thus, cost/complexity pruning, as implemented in the selection of the right-sized tree, makes use of the basic scientific principles of parsimony and replication: Choose as the best theory the simplest theory (i.e., the pruned tree with the fewest terminal nodes) that is consistent with (i.e., has a CV cost no greater than Min. CV plus Standard error rule times Min. SE ) the theory best supported by independent tests (i.e., the pruned tree with the smallest CV cost).