OLE Object Properties
This dialog box is used to anchor and format OLE objects in the current graph.
Note: The dialog box title bar will display an object identifier number that can be referenced when using STATISTICA Visual Basic code to customize graph objects.
- Coordinates (left-upper)
- Use the options in the Coordinates group box to anchor the object either dynamically to a particular plot, or to make the placement of the object independent of the scaling in the graph. See Anchoring Objects to Coordinates for details regarding the distinction between dynamic and non-dynamic (fixed) anchoring of objects in graphs.
- Dynamic (anchor to Plot)
- Select the Dynamic check box to anchor the object dynamically to the plot selected in the Plot drop-down box (see Anchoring Objects to Coordinates).
- Options for compound graphs
- Compound graphs are those that consist of more than one graph and/or graph type in a single display, such as:
- Categorized plots (categorized by one or two variables)
- Matrix plots, such as matrix scatterplots, line plots, etc.
- Scatterplots with box-plots or Scatterplots with histograms
For these types of graphs, additional options exist to precisely control the location ("anchor point") where the extra graph object is to be attached. Note that different types of dialogs will be displayed depending on the type of compound graph to which you are attaching an object. Refer to Extra Objects in Compound Graphs for additional details.
- Line
- Select the Line check box to show the line for the object (circle, custom drawing, box, etc.). Click on the Line button to display the standard Line Properties dialog box, to customize the color and line type for the line.
- Area
- Select the Area check box to fill the background area for the object (circle, custom drawing, box, etc.); this is useful when you have gridlines included in the graph, and you don't want those lines to show behind and running through the object. Click on the fill Area button to display the standard Area Properties dialog box, to customize the background for the object.
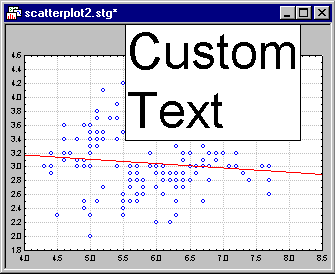
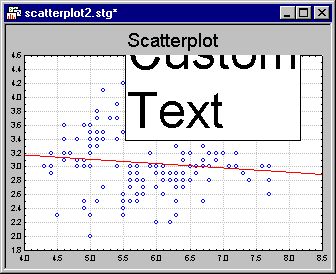
- Clip to graph frame
- This option determines whether the respective extra graph object (e.g., line, text, etc.) will only be drawn inside the plot area of the graph, or whether it will also show outside the plot area, in the margins of the graph. If you select this check box, then the object will be "clipped" at the edges of the plot region for the graph, for example:
Clip to Graph Frame: OFF
Clip to Graph Frame: ON
- Save as Default
- Click the Save as Default button in order to save the current object properties as the default properties applied to future OLE objects.
- Styles
- Click the Styles button to display the Graphics Styles dialog box; see Graphics Styles Overview for additional details.
Copyright © 2021. Cloud Software Group, Inc. All Rights Reserved.