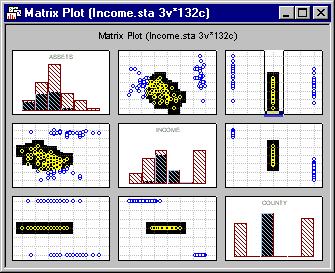
How can I use the slices brush?
- 2D graphs
- When the brushing facility has been activated for a 2D graph such as a matrix scatterplot, available brush types in the Selection Brush group in the
Brushing dialog box include Slice X and Slice Y. When one of these is selected, the brushing tool can be used to define a vertical (Slice X) or horizontal (Slice Y) rectangle or "slice" of variable width on any of the individual graphs.
All of the point markers within the rectangular slice will become highlighted, and the corresponding point markers on the remaining matrix scatterplots will also be highlighted. Corresponding data will also be highlighted (by default colored red) in the Graph Data Editor.
If the Auto Animate check box on the Interactive tab of the Brushing dialog box is selected, and the Animate button in the dialog box is clicked, the slice will move back and forth on the x-axis (Slice X) or up and down on the y-axis (Slice Y) successively highlighting points that fall within the slice on all the graphs. The movement of the slices is controlled by the options in the Animation dialog box that is displayed when the animation begins.
If the Slice X selection brush was chosen, the X Step slider will control the increments at which the slice moves across the x-axis. The Y Step slider will control increments at which the slice moves on the y-axis if the Slice Y selection brush was chosen. The automatic pause between successive incremental movements of the slice is controlled by the setting of the Waiting time slider. The Pause button located near the top of the Animation dialog box can be toggled to start and stop the animation, and a Reset button is available to start the animation over at the location on the graph where the slice was originally defined.
- 3D graphs
- The slicing tools discussed above can also be applied in 3D graphs such as 3D scatterplots. In this context, the individual slice tools define a rectangular prism on the graph. All of the points within the prism will be highlighted, as well as corresponding points in the Graph Data Editor. In 3D graphs, slices can be defined for x-, y-, or z-axes, and the prisms can be automated in a manner analogous to that described above for slices on 2D graphs. Note that in 3D graphs, a Cube selection brush is also available to define a 3D prism of any size within the graph. This tool performs in a manner analogous to the Box tool in 2D graph brushing, and it can be animated to move incrementally within the body of the graph in the x, y, and z directions.


