Example: Model Profiler in Distributions & Simulation
When used in Distributions & Simulation, the Model Profiler makes it possible for you to observe the performance of different models saved as PMML files based on settings you specify.
Ribbon bar. Select the Home tab. In the File group, click the Open arrow and select Open Examples to display the Open a STATISTICA Data File dialog box. The data file is located in the Datasets folder. Then, select the Statistics tab. In the Base group, click More Distributions to display the Distributions & Simulation Startup Panel.
Classic menus. From the File menu, select Open Examples to display the Open a STATISTICA Data File dialog box. The data file is located in the Datasets folder. Then, from the Statistics menu, select Distributions & Simulation to display the Distributions & Simulation Startup Panel.
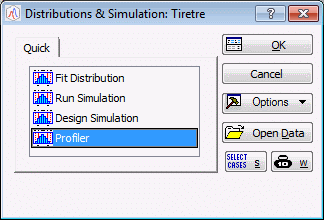
On the Quick tab of the Startup Panel, select Profiler.
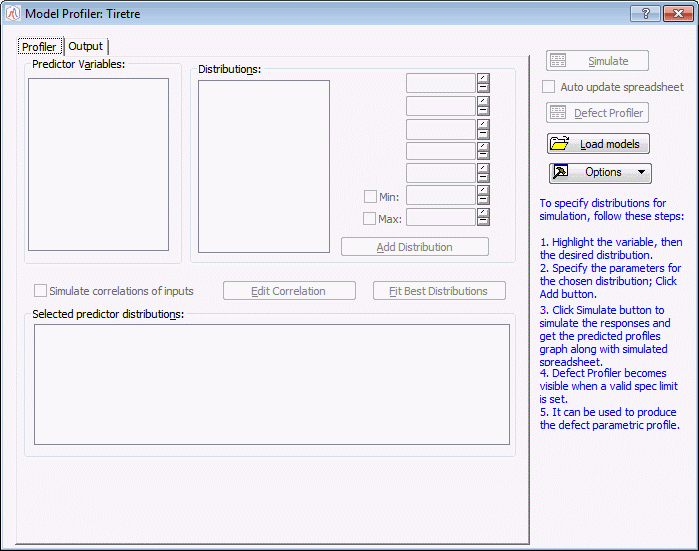
Click the OK button. The Model Profiler will be displayed.
Click the Load Models button to display the Open PMML files dialog box, which is used to browse to and open a previously saved PMML file.
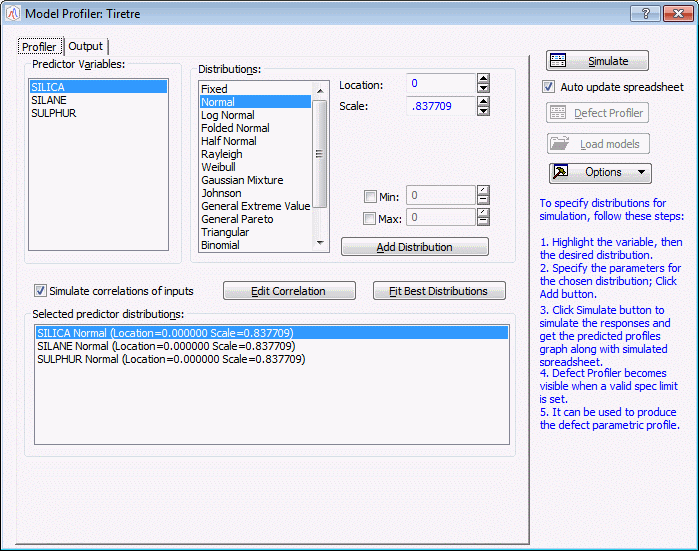
Select GLM PMML script1.xml from the example Datasets folder. When you click the Open button, the Model Profiler will apply the model specified in the PMML file to the data in the Tiretre.sta data file.
Also generated is the Simulated Results.sta data file, which contains the 5,000 runs as specified by default in the Model Profiler. (You can change the number of runs in this simulation by changing the setting for No. of runs on the Output tab of the Model Profiler.) Also generated is a graph that includes the profiles for predicted values.


