Example 1: CHAID Classification Tree
This example illustrates an analysis of the Boston housing data (Harrison & Rubinfeld, 1978) that was reported by Lim, Loh, and Shih (1997). This data file is also used in Example 2: Discriminant-Based Univariate Splits for Categorical and Ordered Predictors in the Classification Trees Analysis module. Median prices of housing tracts are classified as Low, Medium, or High on the dependent variable Price. There is 1 categorical predictor, Cat1, and 12 ordered predictors, Ord1 through Ord12. A duplicate of the learning sample is used as a test sample. The sample identifier variable is Sample and contains codes of 1 for Learning and 2 for Test. The complete data set containing a total of 1,012 cases is available in the example data file Boston2.sta. Open this data file via the File - Open Examples menu; it is in the Datasets folder. Part of this data file is shown below.
- Specifying the Analysis
- Begin the analysis by selecting General CHAID Models from the Data Mining menu to display the General CHAID Models Startup Panel. Select Standard CHAID as the Type of analysis on the
Quick tab and click OK to display the
General CHAID Models Quick specs dialog (Standard CHAID). On the
Quick tab, click the Variables button; on the variable specification dialog, select variable Price as the Dependent variable, variable Cat1 as a Categorical pred variable, and variables Ord1 through Ord12 as the Continuous pred variables; click the OK button. Then, select the Categorical response check box. Click the Response codes button and click the All button on the resulting
Select codes for dialog to select all codes. Repeat this process to select all factor codes by clicking the Factor codes button and clicking the All button on the resulting
Select codes for dialog.
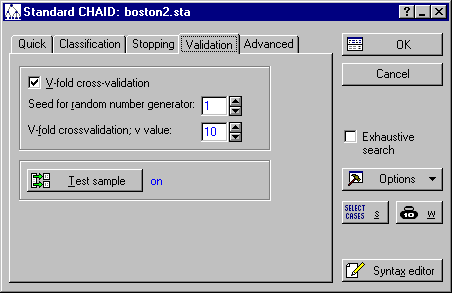
Click on the Validation tab and select the V-fold cross-validation check box. Also, click the Test sample button to display the Cross-Validation dialog. Click the Sample identifier variable button and select variable Sample. Learning (the default value) is the Code for analysis sample; also set the Status to On.
Click OK on the Cross-Validation dialog to return to the General CHAID Models Quick specs dialog.
Leave all other defaults and click OK to begin the analysis, and then to display the General CHAID Models Results dialog.
- Reviewing Results
- First, click the Tree graph button on the
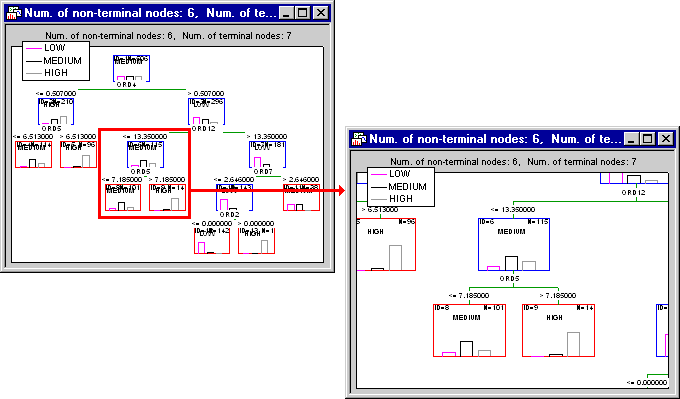
Summary tab to review the summary graph; note that you can use the standard zooming tools to review particular branches of the tree.
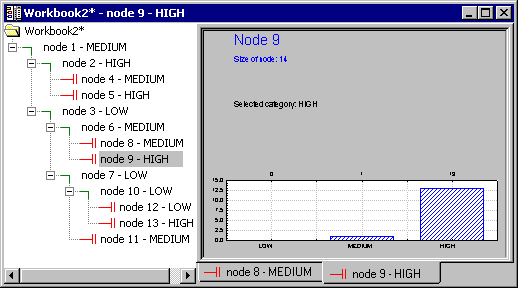
As also described in General Computation Issues and Unique Solutions of STATISTICA GCHAID (see Reviewing Large Trees: Unique Analysis Management Tools in GC&RT Introductory Overview - Basic Ideas Part II), the most convenient way (and most standard way, from the user-interface point of view) to review information in trees is via the tree browser. Click the Tree browser button to review the final tree in the efficient Workbook Tree Browser.
As also described in the Workbook Tree Browser, it is easy to review large trees by clicking the nodes in the left pane and observing the changes in the distribution of the observations assigned to the respective nodes. In fact an "animation-like" effect can be created in this manner.
- Examining Individual Nodes
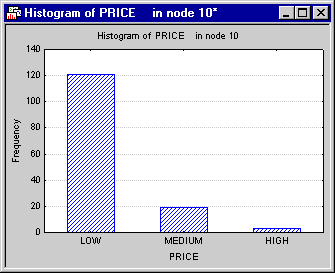
- It is usually of interest to examine in greater detail the results for nodes that are particularly pure, i.e., contain almost exclusively observations belonging to the same class. One such node in this example is Node 10. Click on the
Node tab and select 10 in the Node id box. Then click the Histogram of DV belonging to node button,
and the Data belonging to node button.
As you can see, the Low housing prices for observations in this node are associated with the pattern of predictor values shown in the parallel coordinate plot. This type of plot of the pattern of values for each observation over the predictor variables can provide valuable insights into overall "patterns" for observations classified into (or predicted to belong to) a particular node.
Of course, for predictive purposes, the sequence of if-then conditions (splits) that lead to the respective node of interest - as shown in the summary tree graph or the Workbook Tree Browser - is of greatest interest.


