Axis: General (2D Graphs)
These options, available on the Axis: General tab of the Graph Options dialog box, are used for customizing the display of the graph axes. Separate options are available for each graph axis and the changes that you make for each axis are independent of one another (unless any of the Copy axis specs to options are selected to transfer the settings to other axes, see below). Therefore, the following descriptions of the scale options will apply to each axis in the graph.
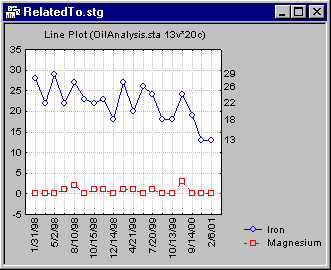
For additional details, see also the description of the Related to plot dialog box, which can be displayed from the Axis: Scale Values tab of the Graph Options dialog box, to accomplish the same assignment of axes to plots.
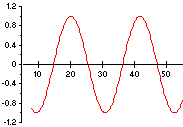
When X is selected as the current Axis (see above), you can shift the x-axis up by specifying a negative number in the edit field.
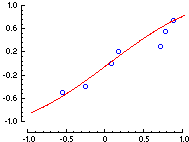
In order to show that there is no causal relation between the X and Y variables, shift both variables by specifying a positive value in the edit field of the respective axes x and y (causing a break where the x- and y-axes meet).


