Contents
Before starting the Cluster Monitor, an active license is required (see Activation in TIBCO Streaming and Model Management Server). To enable the activation service for the Cluster Monitor application place a license file in the default directory.
The Cluster Monitor application is a ready-to-run and configurable StreamBase Application that monitors the performance of clusters and nodes in a StreamBase Runtime fabric. The application consists of a StreamBase monitoring EventFlow fragment and a LiveView server fragment. The application:
-
Dynamically discovers cluster elements (nodes, JVMs).
-
Dynamically discovers changes to the cluster population.
-
Provides StreamBase performance data for EventFlow and LiveView JVMs.
-
Provides StreamBase Runtime performance data for nodes.
-
Publishes results into a set of LiveView tables.
-
Provides a set of LiveView Web cards that present a customizable view of the data.
Using the default configuration, the LiveView server automatically enables LiveView Web as the client to display cluster monitoring data.
Release 10.6.1 introduces new enhancements to the Cluster Monitor application as follows:
-
TLS connections are now supported between the client and the Cluster Monitor application. See below for details.
-
The
NODE_NAME HOCONsubstitution variable at installation time is no longer required. The default installation now looks like:$ epadmin install node --application _product_install_dir_/distrib/tibco/sb/applications/ cluster-monitor.zip
-
The sample (all inclusive) node configuration file,
cluster-monitor-node.conf, was removed. -
Configuration was streamlined to improve application efficiency.
Note
The Cluster Monitor application must be run in a separate cluster from the one containing the applications being monitored.
-
Run the epadmin install node command to enter a node name where you are installing the Cluster Monitor application. For example,
monitor..monitorCluster-
On Windows, you must use a StreamBase Command Prompt.
-
On macOS and Linux, you must use a shell with a StreamBase-ready environment, as described in StreamBase-Configured Shells.
The epadmin install node command example below wraps to the next lines for clarity but must be entered as one command. Adjust your command based on your installed platform location.
Windows
epadmin install node --nodename=monitor.
monitorCluster--application=C:/TIBCO/str/11.2/distrib/tibco/sb/applications/cluster-monitor.zipLinux
epadmin install node --nodename=monitor.
monitorCluster--application=/opt/tibco/str/11.2/distrib/tibco/sb/applications/cluster-monitor.zipmacOS
epadmin install node --nodename=monitor.
monitorCluster--application=$HOME/Applications/TIBCO\ Streaming\ 11.2.1/distrib/tibco/sb/applications/ cluster-monitor.zip -
-
Verify your Cluster Monitor node is installed. Look for output similar to the following (Windows example shown):
C:\Users\sbuser\Documents\StreamBaseWorkspace\example1>epadmin install node
--nodename=monitor.monitorCluster --application=C:/TIBCO/str/11.2/distrib/tibco/
  sb/applications/cluster-monitor.zip
[monitor.monitorCluster]        Installing node
[monitor.monitorCluster]                PRODUCTION executables
[monitor.monitorCluster]                File shared memory
[monitor.monitorCluster]                7 concurrent allocation segments
[monitor.monitorCluster]                Host name sbuser
[monitor.monitorCluster]                Starting node services
[monitor.monitorCluster]                Loading node configuration
[monitor.monitorCluster]                Auditing node security
[monitor.monitorCluster]                Deploying application
[monitor.monitorCluster]                        Engine cluster-monitor
[monitor.monitorCluster]                Application deployed
[monitor.monitorCluster]                Administration port is 31218
[monitor.monitorCluster]                Service name is monitor.monitorCluster
[monitor.monitorCluster]        Node installed
-
Once the Cluster Monitor node is installed, start it by running the following command:
epadmin --servicename=monitor.
monitorClusterstart node -
Verify the Cluster Monitor node started. Look for output similar to the following (Windows example shown) or through Studio's Cluster view:
C:\Users\sbuser\Documents\StreamBaseStudioWorkspace\example1>epadmin
--servicename=monitor.monitorCluster start node
[monitor.monitorCluster]      Starting node
[monitor.monitorCluster]              Engine application::cluster-monitor started
[monitor.monitorCluster]              Loading node configuration
[monitor.monitorCluster]              Auditing node security
[monitor.monitorCluster]              Host name sbuser
[monitor.monitorCluster]              Administration port is 31218
[monitor.monitorCluster]              Service name is monitor.monitorCluster
[monitor.monitorCluster]      Node started
-
Verify the LiveView server is now active. Depending on your system performance, this may take several minutes. Look for the following message in the
monitor.file to confirm the LiveView server is active:monitorCluster/logs/cluster-monitor.log*** All tables have been loaded. LiveView is ready to accept client connections.
Optionally, use the epadmin tail logging command to watch the log file:
epadmin --servicename=monitor.
monitorClustertail logging --enginename=cluster-monitorSee the Tail Logging for details regarding the epadmin logging target.
Once the Cluster Monitor node is started and the Cluster Monitor application is running, open a browser to view cluster data in LiveView Web for your running application nodes.
Enter: http://localhost:11080/lvweb. The Cluster Monitor application uses 11080 as its default LiveView Web port, to avoid conflicts with the standard LiveView
Web port, 10080.
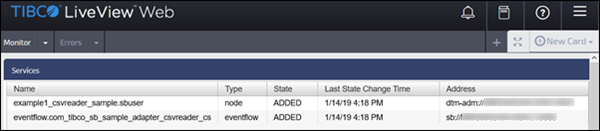
LiveView Web displays cluster statistics using the following set of LiveView Web cards:
- Services
-
Discovered Services.
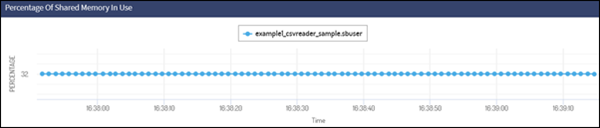
- Percentage of Shared Memory in Use
-
Amount of shared memory in use, per node.
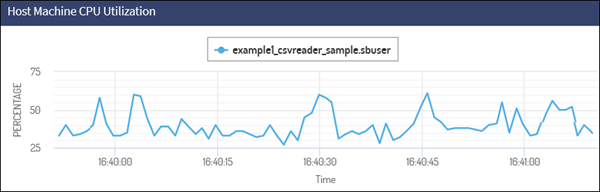
- Host Machine CPU Utilization
-
CPU utilization, per node host machine. Note that multiple nodes running on a single host will report the same information.
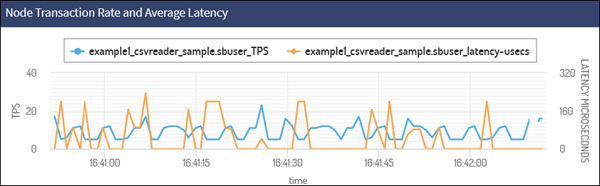
- Node Transaction Rate and Average Latency
-
The transaction rate and average latency, per node.
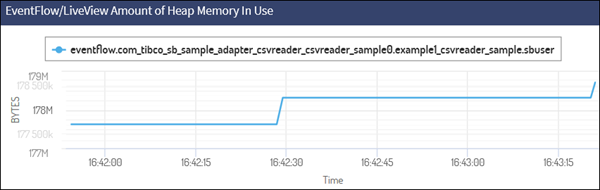
- EventFlow/LiveView Amount of Heap Memory In Use
-
The amount of Java heap memory in use, per EventFlow/LiveView engine.
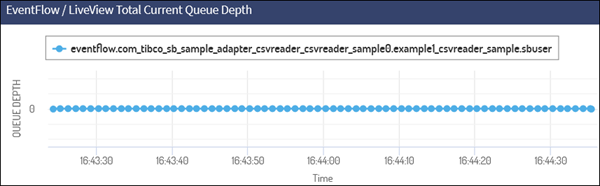
- EventFlow/LiveView Total Queue Depth
-
The total queued tuple depth per EventFlow/LiveView JVM.
The following monitoring behavior parameters are configurable:
-
Service discovery
-
Credentials for statistics collection
-
Administration commands
-
Table naming
-
Table aging
-
LiveView listener port
You can change the Cluster Monitor application's configuration:
-
At node/application installation time by replacing the default node deploy configuration in the supplied
cluster-monitor-node.conffile. Look for thecluster-monitor-node.conffile in thecluster-monitor.zipfile. -
While the Cluster Monitor application is running by loading and activating a Service Discovery adapter configuration, a Cluster Monitor configuration, or both. See:
-
StreamBase Cluster Monitor Configuration for individual Cluster Monitor configuration property details.
-
StreamBase Service Discovery Configuration for individual Service Discovery adapter configuration property details.
-
After activating a new configuration, restart the Cluster Monitor application with the following command:
epadmin --servicename=MONITOR_NODE_NAME restart container --engine=cluster-monitor
Note
Replace EP_NODE_NAME with the name of the node where the Cluster Monitor application is installed.
For reference, the following shows the cluster-monitor-node.conf configuration file properties:
//
//  Copyright (c) 2020-2023 Cloud Software Group, Inc.
//  All Rights Reserved.  Confidential & Proprietary.
//
// Node deploy configuration for the Streaming Cluster Monitor.
//
name = "ClusterMonitor"
version = "1.0"
type = "com.tibco.ep.dtm.configuration.node"
configuration =
{
    NodeDeploy =
    {
        nodes  =
        {
            "${EP_NODE_NAME}" =
            {
                description = "Node for running the ClusterMonitor"

                engines =
                {
                    "cluster-monitor" =
                    {
                        fragmentIdentifier = "com.tibco.ep.cluster.liveview-server"
                    }
                }
            }
        }
    }
}The Cluster Monitor configures the following statistics tables by default:
Services Table: The monitor always contains a Services table showing services that have been discovered and their current state.
| Field Name | Type | Notes |
|---|---|---|
| serviceState | string | |
| serviceName | string | Primary key |
| serviceAddress | string | Approves or rejects artifacts committed by other users |
| serviceChangeTime | timestamp |
StreamBaseInfo Table: EventFlow/LiveView server Java heap memory use, and aggregate total number of queued tuples.
| Field Name | Type | Notes |
|---|---|---|
| service | string | |
| id | long | Primary key. Per row unique identifier. |
| time | timestamp | |
| usedMemory | long | Bytes |
| totalQueueDepth | long |
NodeInfo Table: Per node shared memory usage, transaction rate, and deadlock counter, and CPU usage for the machine where the node is running.
| Field Name | Type | Notes |
|---|---|---|
| service | string | |
| id | long | Primary key. Per row unique identifier. |
| time | timestamp | |
| c_Version | long | History command output version |
| c_Shared_Memory_Total | long | Bytes |
| c_Shared_Memory_Used | long | Percentage |
| c_CPU_Percent_User | long | Percentage |
| c_CPU_Percent_System | long | Percentage |
| c_CPU_Percent_Idle | long | Percentage |
| c_Transactions during the last sample | long | Number of per node transactions |
| c_Average_Transaction_Latency_usecs | long | Average transaction length |
| c_Transaction_Deadlocks | long |
Any epadmin target command that generates output may be used. For example, the NodeInfo table is equivalent to the following epadmin command:
epadmin --servicename=monitor.monitorCluster display history --seconds=1By default, the generated table name for epadmin commands is t_COMMAND_TARGET. For the command shown above, this becomes t_display_history. This may be changed via configuration.
The first three columns are common to both epadmin command tables and the StreamBaseInfo table.
The remaining columns consist of the epadmin command output. The output column names are discovered and converted to meet LiveView column name requirements:
-
A leading c_ prefix is inserted.
-
Non alpha-numeric characters are converted to underscores.
-
Multiple underscore sequences are converted to single underscores.
For example, the column name: Shared Memory Size (bytes), is converted to: c_Shared_Memory_Size_bytessec.
The Cluster Monitor application attempts to connect to each discovered service, authenticating each using the configured credentials.
The epadmin commands use the administrationAuthentication section of the ClusterMonitor configuration file, as shown in StreamBase Cluster Monitor Configuration. By default, no credentials are configured. The application is only able to monitor services running on the local node, started
by the same user who installed the Cluster Monitor.
The configuration supports a single set of credentials for epadmin commands, and a single set of credentials for EventFlow and LiveView services. For simplicity, it is a best practice configuring a common login credential throughout the target cluster.
To configure EventFlow and LiveView services information, use the EventFlow section of the ClusterMonitor configuration.
Releases 10.6.1 and above support an optional TLS connection between the client and the Cluster Monitor application. Use the following two supplied files to get you started:
-
The
cluster-monitor-secure.conffile includes options to configure a TLS connection. The file is shipped ininstallation_directory/distrib/tibco/sb/applications -
The
cluster-monitor-secure-subsfile provides the framework for TLS setup, which requires inclusion of the following (not supplied) HOCON configuration files:
To set up a TLS connection, you must supply several substitution values as appropriate to your environment. For the simple
non-TLS case, modifying the supplied cluster-monitor-node.conf is not required. If you have other security needs, see the security governance documentation; you can modify both of the following files to meet your needs.
The cluster-monitor-secure.subs file:
//
//  Copyright (c) 2020-2023 Cloud Software Group, Inc.
//  All Rights Reserved.  Confidential & Proprietary.
//
// Sample nodedeploy configuration for enabling TLS in the cluster monitor.
// Use with cluster-monitor-secure.subs
//
name = "ClusterMonitor"
version = "${VERSION}"
type = "com.tibco.ep.dtm.configuration.node"
configuration = {
    NodeDeploy = {
        nodes  = {
            "${EP_NODE_NAME}" = {
                engines = {
                    "cluster-monitor" = {
                        fragmentIdentifier = "com.tibco.ep.cluster.liveview-server"
                        configuration = [
                            """
                            name = "ClusterMonitorTLSServerConfig"
                            version = "${VERSION}"
                            type = "com.tibco.ep.dtm.configuration.security"
                            configuration = {
                              SecureCommunicationServerProfile  = {
                                name = "${SERVER_SECURE_PROFILE_NAME}"
                                keyStore = "${SERVER_KEYSTORE}"
                                keyStorePassword = "${SERVER_KEYSTORE_PASSWORD}"
                                requireClientAuthentication = false
                              }
                            }
                            """,
                            """
                            name = "ClusterMonitorTLSClientConfig"
                            version = "${VERSION}"
                            type = "com.tibco.ep.dtm.configuration.security"
                            configuration = {
                              SecureCommunicationClientProfile  = {
                                name = "${CLIENT_SECURE_PROFILE_NAME}"
                                trustStore = "${TRUSTSTORE}"
                                trustStorePassword = "${TRUSTSTORE_PASSWORD}"
                                requireClientAuthentication = false
                              }
                            }
                            """,
                            """
                            name = "cluster-monitor-internal-credentials"
                            type = "com.tibco.ep.ldm.configuration.ldminternalcredentials"
                            version = "${VERSION}"
                            configuration = {
                              InternalCredentials = {
                                ldmSecureInternalCommunicationProfileName = "${CLIENT_SECURE_PROFILE_NAME}"
                              }
                            }
                            """
                        ]
                    }
                }
            }
        }
    }
}
The cluster-monitor-secure.conf file:
#
#  Copyright (c) 2020-2023 Cloud Software Group, Inc.
#  All Rights Reserved.  Confidential & Proprietary.
#
#  Sample cluster monitor configuration substitution variables
#  for use with TLS sample file cluster-monitor-secure.conf
#
#  If using plain text passwords:
#
#  $ epadmin install node \
#      --application cluster-monitor.zip \
#      --nodedeploy cluster-monitor-secure.conf \
#      --substitutionfile cluster-monitor-secure.subs
#
#  Or, if using encrypted passwords, replace
#  the --keystore and --keystorepassword values.
#  See Encrypting Sensitive Configuration Data
#  in the StreamBase Administration Guide.
#
#  $ epadmin install node \
#      --application cluster-monitor.zip \
#      --nodedeploy cluster-monitor-secure.conf \
#      --substitutionfile cluster-monitor-secure.subs \
#      --keystore MyNodeSecretKeyStore.jks \
#      --keystorepassword MyNodeSecretKeyStorePassword

#
# Configuration verison number.
# Must be anything other than 1.0.0
#
VERSION = 1.0.1

#
# Name of your server secure profile
#
SERVER_SECURE_PROFILE_NAME = ClusterMonitorServerProfile

#
# Name of your client secure profile
#
CLIENT_SECURE_PROFILE_NAME = ClusterMonitorClientProfile

#
# Absolute path to your server keystore.
#
SERVER_KEYSTORE = /some/where/ServerKeyStore.jks

#
# Server keystore password.
#
# May be plain text or encrypted.
#
SERVER_KEYSTORE_PASSWORD = #!!j/PmnHg/Lg6EnjhB9/LS7owPWQk/nXozuXKXWs6FABaSmQ==

#
# Absolute path to the truststore
#
TRUSTSTORE = /some/where/TrustStore.jks

#
# Encrypted truststore password.
#
# May be plain text or encrypted.
#
TRUSTSTORE_PASSWORD = #!!j/PmnHg/Lg6EnjhB9/LS7owPWQk/nXozuXKXWs6FABaSmQ==

#
# Uncomment to change the default
# default LiveView port from 11080
#
#LIVEVIEW_PORT = 12080