Contents
By default, a running node includes a web server that presents REST API interfaces that support basic node administration functionality, as well as the ability to query the node's health and other metrics.
The REST interfaces are self-documenting, as is standard for OpenAPI-based REST APIs. You can determine the URLs to query a running node with a command like the following:
epadmin servicename=nodename.cluster display web
The example command output below shows the status of the web server as well as the available web services:
[nodename.cluster] Service Name = http.nodename.cluster[nodename.cluster] Network Address = http://example:8008 [nodename.cluster] Web Help UI Address = http://example:8008/helpui [nodename.cluster] Status = STARTED [nodename.cluster] Web Services = admin-ui,admin,metrics,healthcheck
To view the helpui for the REST APIs exposed by the installed web services, copy the URL
from the Network Address or Web Help UI Address as shown in the example above to a browser.
Simply viewing the help in a browser does not require a user name
or password. However, depending on your node's authentication configuration, you may
be prompted to enter a user name — or a user name and password —
when you query the node.
It may be noted that the help UI is the default path in normal operation. If the node determines itself to be running in a Kubernetes pod, it will use the admin-ui path as the default instead.
 |
When a web service starts, it publishes a REST endpoint. The REST API page then presents the help UI for your node. At the top of the API page, select one of the following supported web services from the dropdown list. Note that web service support varies for nodes running EventFlow or LiveView fragments:
-
healthcheck (EventFlow fragments) — Provides a simple check for the current node status. The returned node status can be one of:
-
STARTED
-
STOPPED
-
-
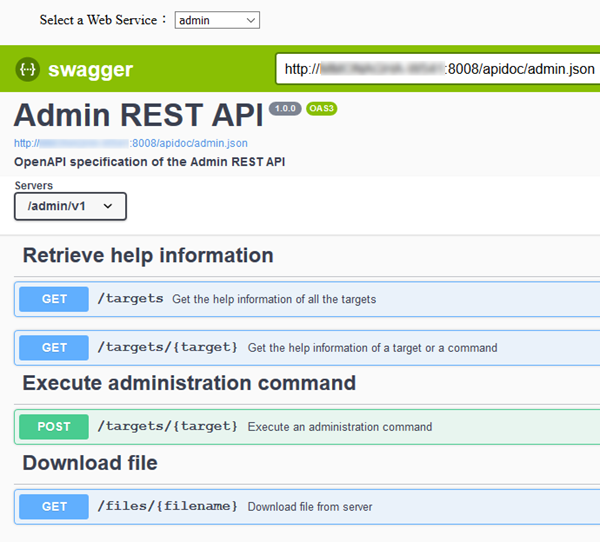
admin (EventFlow fragments) — Provides access to all available epadmin commands. Use to query the following endpoints:
-
GET /targets — Use to get help information from all available epadmin command targets for your node.
-
GET /targets/{target} — Use to get help information of a specific target.
-
POST /targets/{target} — Run an administration command.
-
GET /files/{filename} — Download the file with the given name.
-
-
metrics (EventFlow, LiveView fragments) — Provides:
-
GET /metrics — Use to list all available metrics, which can include built-in engine and node metrics as well as user-built ones. Supported metrics types are:
-
Gauge: an instantaneous measurement of a value.
-
Counter: a gauge with values you can increment or decrement.
-
Meter: measures the rate (Rates) of events over time (for example, requests-per-second). The meter metric also tracks 1-, 5-, and 15-minute moving averages.
-
Histogram: measures the statistical distribution (Snapshot) of values in a data stream. In addition to minimum, maximum, mean, and so on, histogram also measures the median, 75th, 90th, 95th, 98th, 99th, and 99.9th percentiles.
-
Timer: measures both the rate that a particular piece of code is called and the distribution of its duration.
-
-
GET /metrics/{name} — Use to list individual metrics information based on the metric name.
-
-
admin-ui — The admin-ui web interface debuted in 10.6.1 as the TIBCO Streaming Web Administration Interface. The Interface allows you to monitor and configure your Streaming clusters, nodes, availability zones, partitions, and other aspects of the StreamBase Runtime. While not currently accessible in the help UI, you can use the Interface as described here.