This article describes how to manage and deploy applications onto nodes.
This section describes how to install an application onto a node. To install an application requires:
-
the target machine name.
-
a supported Java environment installed on the target machine.
-
firewall configured to allow required network ports on target machine (see Port and Firewall Requirements).
-
the TIBCO Streaming product installed on the target machine.
-
the application archive to install.
-
an optional node deploy configuration file.
-
access to the epadmin command line tool.
Node installation can be done remotely as long as the TIBCO Streaming product is installed on the machine and SSH access is available (see Secure Shell).
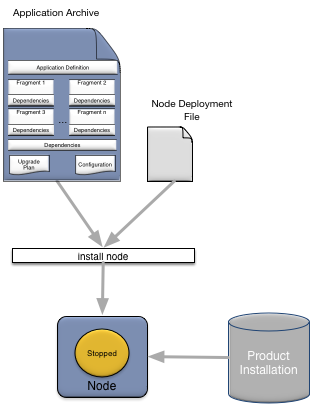
A node is installed to host an application using the epadmin install node command. In general only these parameters (see epadmin-node(1) for a complete install node parameter reference) need to be specified when installing a node:
-
application— the application archive. -
javahome— optional path to the Java environment if not located at theJAVA_HOMEenvironment variable or a built-in platform default. -
nodedeploy— an optional node deploy configuration file. -
nodedirectory— an optional directory in which the node should be installed. -
nodename— the fully qualified service name for the node.
If a node deploy configuration file is specified using the nodedeploy parameter it must contain a definition for the node being installed. For example, if a node named A.X is being installed, the node deploy configuration file must contain a nodes entry for A.X:
name = "my.application"
version = "1.0.0"
type = "com.tibco.ep.dtm.configuration.node"
configuration =
{
    NodeDeploy =
    {
        nodes =
        {
            "A.X" = { ... }
        }
    }
}
Here is an example of installing an application on a node:
epadmin install node --nodename=A.X --nodedirectory=/opt/tibco/deploy/nodes --application=payments.zip --nodedeploy=payments.conf
After a node has been installed, the node directory has been created and management processes have been started. The node must now be started to start the application. See Starting Nodes for details on starting a node.
As part of node installation, default application and node configuration information is installed. Both the application and node configuration information can be overridden by specifying a node deploy configuration file when installing a node. The default configuration can also be augmented using the node deploy configuration file. Node deployment configuration files are described in detail in Node Deploy Configuration.
When an application is initialized there is a well defined order in which configuration is processed:
-
Default configuration built in to the product.
-
Application definition configuration in the application archive.
-
Node deploy configuration in the application archive.
-
Node deploy configuration specified on the
install nodecommand line. -
Configuration from fragments contained in the application archive, loaded in reverse classpath order. See Fragment Configuration Load Order for more details.
-
Configuration from the application archive.
-
Configuration from the global configuration section (see NodeDeploy) in the node deploy configuration file.
-
Configuration from the node configuration section (see Node) in the node deploy configuration file.
-
Configuration from the engine binding configuration section (see EngineBinding) in the node deploy configuration file.
Configuration specified in the node deploy global or per-node configuration sections is processed in the order in which it is specified in the file — the first configuration is processed first, the second next, and so on.
This implies that configuration loaded after other configuration can override previously loaded and activated configuration (see the Configuration chapter in the Architects Guide for details on configuration replacement). A failure to load or activate a configuration file will cause the node startup to fail. See Starting for more details.
When an application is installed, fragment configuration is loaded using the classpath of the top-level fragment (Fragment-A and Fragment-B in Figure 2, “Application dependencies”) engines. For each engine, fragment configuration is loaded in reverse classpath order. If there are duplicate dependencies
in the classpath, the configuration for the duplicate dependency is loaded only once when the dependency is first processed
during start-up. If an application archive itself has multiple classpath elements containing configuration, this configuration
is also loaded in reverse classpath order. Finally, if there are multiple configuration files in a single classpath element,
they are loaded in ASCII sort order.
Configuration load ordering between engines is undefined.
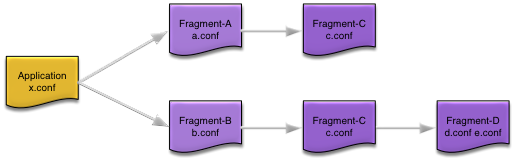
Using the application dependencies in Figure 2, “Application dependencies”, configuration would be loaded in this order (assuming Fragment-A engine is loaded before Fragment-B engine — this is undefined behavior).
-
Fragment-A engine
-
c.conf
-
a.conf
-
-
Fragment-B engine
-
d.conf
-
e.conf
-
(c.conf skipped, already loaded as part of Fragment-A engine processing)
-
b.conf
-
-
Application
-
x.conf
-
A subset of the install node parameters can also be set in configuration as shown in Install node parameter mapping to configuration properties. If a value is set both in configuration and on the command line, the command line value takes precedence.
Note
It is a best practice that you use configuration instead of command line parameters to ensure consistency of application deployment on multiple machines.
Install node parameter mapping to configuration properties
| Install Parameter | Configuration Property |
|---|---|
adminhost |
Administration.address (see Administration)
|
adminport |
Administration.transportPort (see Administration)
|
application |
None |
buildtype |
Execution.buildType |
deploydirectories |
None |
discoveryhosts |
Communication.discoveryRequestAddresses (see Communication)
|
discoveryport |
|
javabinarypath |
None |
javaenvironment |
None |
javahome |
None |
javalibrarypath |
None |
memoryallocators |
SharedMemory.memoryAllocators |
memorysize |
SharedMemory/memorySizeBytes |
memorytype |
SharedMemory.memoryType |
nodedeploy |
None |
nodedirectory |
None |
nodename |
None |
producthome |
None |
substitutions |
None |
substitutionfile |
None |
webenabled |
Administration.webEnable (see Administration)
|
webport |
Administration.webPort (see Administration)
|
When all dependencies are not packaged into an application archive, they must be made available to each node running the application using either engine configuration or deploy directories.
The JavaEngine.externalClassPath and JavaEngine.externalNativeLibraryPath configuration values can be used to define locations on the local machine running a node where Java and native library dependencies
can be located. See JavaEngine for more details on these configuration values.
Deploy directories provide a mechanism for adding JAR, WAR, class files, or native libraries that are not packaged in an application archive to an engine's class path or shared library path without having to define any configuration.
Deploy directories, and all JAR and WAR files contained in a deploy directory, are added to an engine's class path. The deploy directory is also added to the engine's shared library path.
Nested directories in a deploy directory are not added to the class path or shared library path, or searched for JAR or WAR files. The exception is if a JAR or WAR file is in an engine deploy directory (see Engine Deploy Directories).
Warning
There is no support for native libraries in engine deploy directories.
Node deploy directories are optionally specified during node installation and upgrade. See epadmin-node(1) for details on setting node deploy directories from the epadmin command line.
Node deploy directories apply to all engines running on a node.
Engine deploy directories apply to the engine whose name matches a directory name. See Node Deploy Configuration for details on how to set an engine name in the node deploy configuration.
Engine deploy directories are optional and they are not automatically created; they must be manually created.
Engine deploy directories are located within existing node deploy directories.
Figure 3, “Deploy directories” shows an example where the node deploy directories were set to /a/jars and /b/wars at node installation time, and two engine deploy directories named EngineOne and EngineTwo were created under them with the JAR and WAR files installed as shown in Figure 3, “Deploy directories”.
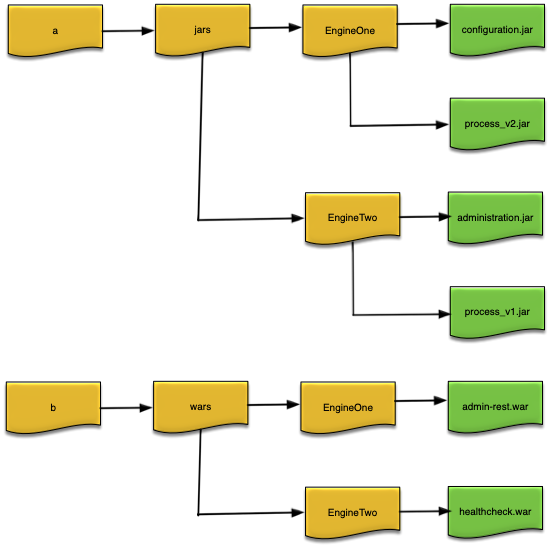
When EngineOne and EngineTwo are started they will be have these JAR and WAR files and directories added to their class paths:
-
EngineOne—/a/jars/EngineOne/configuration.jar:/a/jars/EngineOne/process_v2.jar:/a/jars/EngineOne:/a/jars:/b/wars/EngineOne/admin-rest.war:/b/wars/EngineOne:/b/wars -
EngineTwo—/a/jars/EngineTwo/administration.jar:/a/jars/EngineTwo/process_v1.jar:/a/jars/EngineTwo:/a/jars:/b/wars/EngineTwo/healthcheck.war:/b/wars/EngineTwo:/b/wars
When an engine is started, all configured node deploy directories are searched in the order specified at node installation or upgrade for sub-directories with the same name as the engine being started. If a matching sub-directory is found, all JAR and WAR files found within are sorted by name, in ascending ASCII order, and added to the engine's class path, and then the sub-directory is added to the class path.
Next any JAR and WAR files found in node deploy directories are automatically added to the engine's class path and the node deploy directory itself is added to the class path. The top level of the deploy directories are scanned in the order specified at node installation or upgrade time, and within each deploy directory the JAR and WAR files are sorted by name, in ascending ASCII order, and added to the engine's class path.
A node inherits all environment variables set in the environment in which the node was installed. This provides a mechanism to make environment variables available to deployed applications. The inherited environment is printed in the node coordinator's log file. Any changes to environmental variables after a node is installed do not affect the node's inherited environment.
There is special handling of the executable search path, such as PATH, and the shared library search path, such as DYLD_LIBRARY_PATH. Both the executable and library search paths inherited from the environment are appended to the paths defined by the node.
This ensures that a setting in the inherited environment cannot cause incompatibilities with a node's required environment.
When a node is installed, it has the default security policies described on Default Security Configuration
A user is defined in the default local authentication realm when a node is installed using the user name determined from the
operating system context in which the node installation was done. This is the name of the user logged into the operating system
when performing a node installation. By default this user has a random password assigned and they are granted administrator role privileges, which give that user full administrative access to the node. This user can only access the node from a trusted
host since the password is unknown. The password should be changed to a known value (see
epadmin-password(1)) to allow this user to access the node from a non-trusted host.
A known password can also be set for the operating system user on the command line using the password parameter to install node. For example,
//
//    The operating system user will have a password of admin
//    instead of a random password
//
epadmin --password=admin install node --nodename=A.X
A user definition is also automatically defined in the local authentication realm for the optional username and password parameters specified when installing a node. This user definition uses the value of the username parameter as the principal name and the value of the password parameter as the text credential. This principal definition is granted administrator role privileges. For example, this command will define a user named guest with a password of guest for the node being installed.
epadmin --username=guest --password=guest install node --nodename=A.X
The operating system user name, and the user name specified when installing a node, may be the same or different. Both users are granted the same privileges and access to the node. The only difference is that the operating system user can perform administrative commands on the local node without specifying a user name or password because of the default trusted host configuration described next.
Additional local authentication realm users can be defined during node installation by including a LocalAuthenticationRealm (see Local Authentication Realm) configuration as described in Overriding Default Configuration.
The default trusted host configuration defines localhost, and the actual host name where the node is being installed, as trusted hosts. This allows the operating system user to administer
the node without specifying a user name or password when running administrative commands from the same machine on which the
node was installed. This is accomplished by epadmin using the operating system identity when running administrative commands if no user name and password is specified. Since
the operating system user was defined as a principal with administrative privileges on the node during installation, they
are allowed to run any administrative command.
See Runtime Security Configuration for additional details on the security architecture and configuration.
This section discusses node management, other that installation which was described in Application Installation. Node management can be done using JMX consoles or epadmin.
The current status of a node can be displayed using this command:
epadmin --servicename=A.X display node
This information is displayed for the target node:
-
Node Name — the node name.
-
Node Description — configured node description, if any.
-
Node State — current node state.
-
Host Name — host name of machine on which node is running.
-
Administration Port — node administration port number.
-
Discovery Service Implementation — either
UDPorKubernetes. -
Discovery Service Port — discovery service port number (
UDP) orNot applicable(Kubernetes). -
Discovery Service State — status of discovery service.
-
Node Directory — directory where node is installed.
-
Deployment Directories — node deployment directories.
-
Install Time — time node was installed.
-
Last Start Time — last time node was started.
-
Build Type — type of product build being used — one of
DEVELOPMENTorPRODUCTION. -
Product Version — product version number.
-
Product Installation Directory — product installation location.
-
Sensitive Configuration Data Encryption — whether or not data encryption is configured — one of
DisabledorEnabled. -
Secure Communication Profile — name of configured secure communication profile being used for administration and data transport. Value is
Noneif a secure communication profile is not configured.
Example output from the display node command:
epadmin --serviceprefix=false --servicename=A.sbuser display node
Node Name = A.sbuser
Node Description = No description
Node State = Started
Host Name = bwrought.local
Administration Port = 54220
Discovery Service Implementation = UDP
Discovery Service Port = 54321
Discovery Service State = Running
Node Directory = /Users/bwright/Documents/ws/Studio_1060G/.nodes/A.sbuser
Deployment Directories = /Users/bwright/Documents/ws/Studio_1060G/.nodes/A.sbuser/deploy
Install Time = 2020-05-01 13:21:41 -0400 UTC
Last Start Time = 2020-05-01 13:21:48 -0400 UTC
Build Type = PRODUCTION
Product Version = TIBCO StreamBase Runtime 10.6.0-SNAPSHOT (build 2004291638)
Product Installation Directory = /Users/bwright/Applications/TIBCO Streaming 10.6.0
Sensitive Configuration Data Encryption = Disabled
Secure Communication Profile Name = None
Once a node has been installed, it must be started.
When a node is started the following occurs:
-
all application fragment engines are started.
-
configuration files with engine affinity (see Engine affinity) are loaded.
-
configuration files with engine affinity are activated.
-
the node joins the cluster.
Any failures detected while loading and activating configuration causes any previously processed configuration files to be deactivated and removed, and node start-up fails.
This command can be used to start a node:
epadmin --servicename=A.X start node
Optionally, this command can be used to start all nodes in cluster X:
epadmin --servicename=X start node
When a node is stopped the following occurs:
-
configuration files with engine affinity (see Engine affinity) that were activated when the was node started are deactivated.
-
configuration files with engine affinity that were loaded when the node was started are unloaded (removed).
-
all application fragment engines are stopped.
-
the node leaves the cluster.
Any configuration that was loaded and activated after a node was started are not deactivated and removed when the node is stopped.
Any failures detected while deactivating and removing configuration are logged, but stopping the node continues.
This command can be used to stop a node:
epadmin --servicename=A.X stop node
Optionally, this command can be used to stop all nodes in cluster X:
epadmin --servicename=X stop node
A stopped node can be restarted to resume application execution.
A node must be stopped before it can be removed. When a node is removed the following occurs:
-
all application node services are stopped.
-
administration services are stopped.
-
all application fragment engines are removed.
-
the node directory is removed.
Warning
Removing a node discards all data stored in the node. Any precious data must be replicated or externalized before removing the node or it will be lost.
This command can be used to remove a node:
epadmin --servicename=A.X remove node
Optionally, this command can be used to remove all nodes in cluster X:
epadmin --servicename=X remove node
Warning
To reclaim System V shared memory a node must be removed using the procedure described in this section. System V shared memory is not released by removing a node directory manually.
A node must be reinstalled after it has been removed.
When a machine on which a node is running is shutdown, the node must be quiesced before shutting down the machine.
Warning
Failure to quiesce a node when a machine is shutdown will require the node to be removed and reinstalled losing all data stored in shared memory.
When a node is quiesced the following occurs:
-
application node services are stopped.
-
administration services are stopped.
These commands are used to quiesce a node:
epadmin --servicename=A.X stop node
epadmin --servicename=A.X terminate node
When the machine is rebooted this command must be used to restart the node:
epadmin start node --installpath=<node-directory>/<node-name>
Please see Operating System Service Management for details on integration with operating system specific service management subsystems to perform these actions automatically.
Named caches are used to control the amount of shared memory allocated to managed objects on a node. Named caches are defined per node.
The Named Caches section contains this information:
-
Name — the cache name.
-
Objects In Cache — total number of objects currently in the named cache.
-
Cache Size — the amount of the shared memory allocated to the named cache.
-
Cache Utilization — percentage of cache currently being utilized.
-
Shared Memory Utilization — percentage of total shared memory currently being used for the named cache.
-
Types In Cache — the types currently contained in the named cache.
-
Flusher Sleep Interval — the sleep interval, in seconds, for the background flusher for the named cache.
-
Maximum Objects Per Flush — the maximum number of objects that will be flushed each time the flusher wakes up.
Note
Named cache statistics are an approximation.
This information is also available using this command:
epadmin --servicename=A.X display cache
To define a new named cache click the button and specify a cache name, or use this command:
epadmin --servicename=A.X create cache --name=MyCache
To remove a named cache, select a row in the Named Cache table, and click the button, or use this command:
epadmin --servicename=A.X remove cache --name="Reference Data"
To move a type from one named cached to another, select a row in the Named Cache table for the named cache to which the type should be moved and click the button, or use this command:
epadmin --servicename=A.X add cache --name=MyCache --type=example.managed.X
The caching policy for a named cache can be set to one of these values:
-
Unlimited — objects are always cached in shared memory.
-
No Caching — objects are never cached in shared memory. Objects are always fetched from a remote node.
-
Sized — the shared memory cache size is specified. Objects are flushed when the specified size is exceeded.
To change the caching policy for a named cache, select the row in the Named Caches table for the named cache to change and click the appropriate button:
-
Disable — sets the caching for the selected type to
No Caching. -
Always — sets the caching for the selected type to
Unlimited. -
Size — brings up a dialog to set a specific cache size for the selected type.
The caching policy can also be set using this command:
epadmin --servicename=A.X set cache --name=MyCache --size=50%
The cache size is specified in one of these ways:
-
Percentage of total shared memory available on node.
-
Absolute size in bytes, kilobytes, megabytes, or gigabytes
Warning
Changing a caching policy may impact system performance if currently cached objects are no longer cached.
This section describes how to manage node configuration. The configuration syntax is Human-Optimized Configuration Object Notation (HOCON). Complete syntax details are in HOCON Syntax Reference.
A complete discussion of configuration life cycle can be found in the TIBCO Streaming Architecture Guide. In summary configuration follows this life-cycle:
-
Configuration is loaded into a node
-
Configuration is activated
-
Configuration is deactivated
-
Configuration is removed from a node
The target node must be in the Started state to perform these configuration actions.
Configuration is loaded into a node using this command:
epadmin --servicename=A.X load configuration --source=myConfiguration.conf
The Ignore memory threshold checkbox is used to allow configuration
data to be loaded in shared memory even if the configured shared memory throttle utilization
is exceeded. Without this override, attempting to load configuration data into congested
shared memory will fail.
All loaded configuration data can be displayed from the Configuration tab for a node, using this command:
epadmin --servicename=A.X display configuration
This information is displayed for each loaded configuration file:
-
Type — Configuration type.
-
Name — Configuration name.
-
Version — Configuration version.
-
State — Current state.
-
State Change Time — Time of last state change.
-
Load Time — Time configuration file was loaded.
-
Initial Activation Time — Initial time configuration was activated.
-
Source — Configuration source file path.
-
Number of Configuration Objects — Number of objects created from the configuration file.
Configuration activation, deactivation, and removal is performed using these commands:
//
//  Activate a deactive configuration
//
epadmin --servicename=A.X activate configuration --type=com.tibco.ep.dtm.configuration.node --name=payments --version=1.0

//
//  Deactivate an active configuration
//
epadmin --servicename=A.X deactivate configuration --type=com.tibco.ep.dtm.configuration.node --name=payments --version=1.0

//
//  Remove configuration from shared memory
//
epadmin --servicename=A.X remove configuration --type=com.tibco.ep.dtm.configuration.node --name=payments --version=1.0
Configuration can be exported using this command:
epadmin --servicename=A.X export configuration --type=com.tibco.ep.dtm.configuration.node --name=payments --version=1.0
Exported configuration can be used to determine exactly how a node is configured and also to easily make modifications to a node's configuration.
To make changes to an existing configuration, export the configuration, modify the configuration values as required, update the version number, and reload and activate the configuration on the node.
When a configuration is exported it contains any values initially set in the configuration along with all default values currently being used because the value was not explicitly set in the configuration when it was loaded.
When a node is installed it automatically starts capturing performance metrics. When an engine is started additional metrics
are automatically captured for each engine. Both the node and engine metrics are always enabled. There are also detailed statistics
available on demand using the statistics administration target (see
epadmin-statistics(1)).
Two types of metrics captured:
-
Histogram — a metric which calculates a distribution of a specific value over time, for example CPU utilization.
-
Meter — a metric which measures mean throughput and a one, five, and fifteen-minute moving average for a specific value, for example transaction rate.
The Node-wide metrics displays all of the node metrics.
Node-wide metrics
The per engine metrics are summarized in Engine metrics. Engine metric names use this general convention — builtin.engine.<engine-name>.<metric-name>.
Engine metrics
Metrics are managed using the metric administration target (see epadmin-metric(1) for command details). Support is provided for these commands:
-
display— display all available metrics -
read— read a metric value -
reset— reset a metric value
For example, the display command displays all metrics supported by a node.
epadmin --serviceprefix false --servicename A.X display metric
Name = builtin.cpu.idle.utilization.percentage
Type = HISTOGRAM
Description = Percent idle CPU utilization for machine hosting node A.X

Name = builtin.cpu.system.utilization.percentage
Type = HISTOGRAM
Description = Percent system CPU utilization for machine hosting node A.X

Name = builtin.cpu.user.utilization.percentage
Type = HISTOGRAM
Description = Percent user CPU utilization for machine hosting node A.X

Name = builtin.engine.my-engine.heap.memory.utilization.bytes
Type = HISTOGRAM
Description = Heap memory used (bytes) for engine my-engine

Name = builtin.engine.my-engine.heap.memory.utilization.percentage
Type = HISTOGRAM
Description = Percent heap memory used for engine my-engine

Name = builtin.engine.my-engine.queue.default:ParallelSequence.depth.second
Type = METER
Description = Queue default:ParallelSequence depth per second for engine my-engine

Name = builtin.engine.my-engine.tuples.rate
Type = METER
Description = Tuple rate for engine my-engine

Name = builtin.node.shared.memory.kilobytes
Type = HISTOGRAM
Description = Shared memory used (kilobytes) for node A.X

Name = builtin.node.shared.memory.percentage
Type = HISTOGRAM
Description = Percent shared memory used for node A.X

Name = builtin.node.transactions.deadlocks.rate
Type = METER
Description = Transaction deadlock rate for node A.X

Name = builtin.node.transactions.latency.average.microseconds
Type = METER
Description = Average transaction latency (microseconds) for node A.X

Name = builtin.node.transactions.total.rate
Type = METER
Description = Transaction rate for node A.X
The current value of a specific metric can be read using the read command.
epadmin --serviceprefix false --servicename A.X read metric \
    --name builtin.node.transactions.latency.average.microseconds
Last Reset = 2020-04-15 07:41:35.317-0700
Last Updated = 2020-04-16 15:32:51.090-0700
Count = 5972713
Mean One Minute Rate = 99.39
One Minute Rate = 85.98
Five Minute Rate = 93.78
Fifteen Minute Rate = 98.22
A metric can be reset using the reset command.
epadmin --serviceprefix false --servicename A.X reset metric \
    --name builtin.node.transactions.latency.average.microseconds
epadmin --serviceprefix false --servicename A.X read metric \
    --name builtin.node.transactions.latency.average.microseconds
Last Reset = 2020-04-16 15:33:19.700-0700
Last Updated = 2020-04-16 15:33:27.204-0700
Count = 757
Mean One Minute Rate = 100.76
One Minute Rate = 90.0
Five Minute Rate = 90.0
Fifteen Minute Rate = 90.0
Metrics are also available via a web service. See Metrics.
Node logging uses the industry standard Logback logging infrastructure. Log files are created in a logs directory in the node directory (see Application Installation for details). By default the logs directory contains these log files:
-
a separate log file for each engine named
<engine-name>.log. -
an audit log named
audit.log. -
a transaction deadlock log named
deadlock.log.
See Default Logback Configuration for complete details on the default logging configuration.
There is also a bootstrap directory in the logs directory. The bootstrap directory contains internal runtime log files that are used by product engineering to diagnose support cases. These log files
are only interesting to the product development team.
The log message severities are summarized in Log message severities. These are the standard Logback severities.
Log message severities
| Severity | Description |
|---|---|
ERROR |
A node-level error caused by a resource problem (memory, disk, file descriptors, etc.), a corrupted product installation with missing required resources, or host machine failures. The node is terminated and must be reinstalled to restore service. |
WARN |
An operational error that impacts a specific operation, application performance or availability of certain services. An operational error is caused by invalid parameters, temporary resource unavailability, or authentication and/or authorization failures. No other node services are affected. The node may automatically recover from this error, but in some cases operator intervention is required for full recovery. |
INFO |
A normal status message for node and engine life cycle, resource start-up information, and environment details, for example library version numbers, class path contents, or location of configuration files. No action required. |
DEBUG |
Mid-level diagnostic debug messages. Should only be enabled on production systems at the request of support. These messages are only interesting to the product development team. |
TRACE |
Low-level diagnostic trace messages. Should only be enabled on production systems at the request of support. These messages are only interesting to the product development team. |
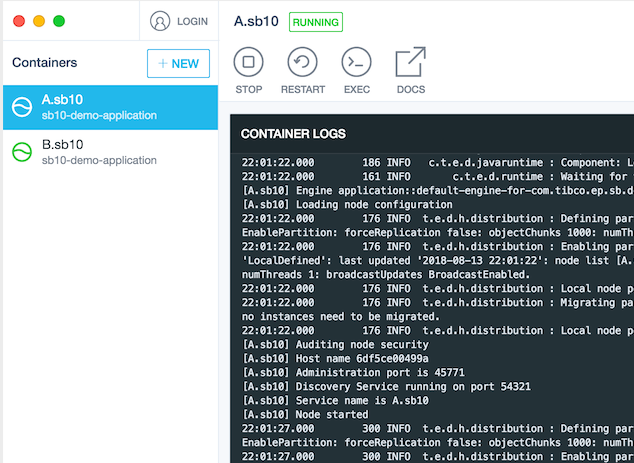
Docker container logging is enabled by configuring a console appender in an application. For example:
<?xml version="1.0" encoding="UTF-8"?>
<configuration>
    <appender name="Console" class="ch.qos.logback.core.ConsoleAppender">
        <encoder>
            <pattern>%d{HH:mm:ss.SSS} %10.10thread %-5level %20.20logger{5} : %msg%n</pattern>
        </encoder>
    </appender>
    <root level="INFO">
        <appender-ref ref="Console" />
    </root>
</configuration>
Note
Enabling a Docker build for an application configures a console log appender by default.
When the container containing the application is started it must have a pseudo-tty allocated for the console appender to work
correctly. This is done using the tty parameter to the run command:
docker run --tty --detach --name A.sb10 --network demo-network sb10-demo-application A.sb10
When the container is started all engine logging will be sent to the container logs as shown in Figure 4, “Docker container logging”.
Container logging is also available from the docker command line using the logs command:
docker logs --follow A.sb10
Log configuration uses standard Logback XML or Groovy configuration files with a few extensions. See the Logback configuration documentation for details on the standard configuration values.
Note
To use Groovy configuration, add an explicit Groovy dependency to the project. For example:
<dependency>
    <groupId>org.codehaus.groovy</groupId>
    <artifactId>groovy</artifactId>
    <version>3.0.1</version>
</dependency>
The supported extensions are:
-
%processformat in log appenderpatternconfiguration — the current process identifier. -
%transactionformat in log appenderpatternconfiguration — the current transaction identifier ornoneif no active transaction, orunavailableif there is an active transaction, but the identifier is not available. -
%usecformat in log appenderpatternconfiguration — the microsecond offset in the current second. -
com.tibco.ep.dtm.logging.logDirectoryLogback configuration file substitution variable — the log directory. The default value is<node-directory>/logs. This can be overridden in Logback configuration files. -
com.tibco.ep.dtm.logging.logFileNamePrefix
While it is possible to move the location of the engine log files outside of the <node-directory>/logs directory using configuration, if this is done, engine log messages are sent to both the configured location of the engine
log file and also the default engine log in the logs directory. This is done to ensure that snapshot files include all logging from the node for diagnostic purposes. If an engine
log file is configured to not use the default engine log file name, but the log file is left in the logs directory, only the configured log file name is used.
This example shows the use of these extensions in a Logback XML configuration file.
<?xml version="1.0" encoding="UTF-8"?>
<configuration>
  <appender name="FILE" class="ch.qos.logback.core.FileAppender">
    <file>${com.tibco.ep.dtm.logging.logDirectory}/${com.tibco.ep.dtm.logging.logFileNamePrefix}.log</file>
    <encoder>
      <pattern>d{HH:mm:ss.SSS} %usec %process %thread %transaction %-5level %logger: %msg%n</pattern>
    </encoder>
  </appender>
  <root level="INFO">
    <appender-ref ref="FILE"/>
  </root>
</configuration>
And here is the same configuration file in Groovy.
import ch.qos.logback.classic.encoder.PatternLayoutEncoder
import ch.qos.logback.core.FileAppender

import static ch.qos.logback.classic.Level.INFO

appender("FILE", FileAppender) {
  file = "${com.tibco.ep.dtm.logging.logDirectory}/${com.tibco.ep.dtm.logging.logFileNamePrefix}.log"
  encoder(PatternLayoutEncoder) {
    pattern = "d{HH:mm:ss.SSS} %usec %process %thread %transaction %-5level %logger: %msg%n"
  }
}
root(INFO, ["FILE"])
Logging configuration is processed in this order; last configuration found is used:
-
Default logging configuration (see Default Logback Configuration).
-
Logging configuration contained in fragment archives.
-
Logging configuration contained in an application archive.
-
Logging configuration contained in a deployment directory (see Deploy Directories). This can be used to override logging configuration packaged in an application archive.
The Logback configuration file resolution rules use the standard LogBack conventions described here. The logging configuration can also be changed at runtime using the logging administration target. See Administration.
Details on packaging logging configuration into fragment and application archives is in the Transactional Memory Developers Guide.
The runtime logging level can be changed using the logging administration target. There is support for both getting and setting the current log level for all loggers running in each
engine in a node.
Note
The ROOT logger defines the default value that all loggers inherit. Once a logger has been created, changing the ROOT logger logging level has no affect on existing loggers. The reset logging command can be used to cause a specific logger to reset its log level to use the ROOT logger default logging level value.
To set the log level for a logger, the logger name must be known. The loggers that are displayed using the display logging command were:
-
explicitly configured as described in Configuration.
-
or previously set using the
set loggingcommand.
For example:
//
//    Get loggers and logging level for the Pattern_sbapp0 engine
//
epadmin --servicename=A.X display logging --enginename=Pattern_sbapp0
Engine Name = Pattern_sbapp0
Logger Name = ROOT
Log Level = INFO

Engine Name = Pattern_sbapp0
Logger Name = com.sun.jersey
Log Level = WARN

Engine Name = Pattern_sbapp0
Logger Name = com.tibco.ep.dtm.audit
Log Level = INFO

Engine Name = Pattern_sbapp0
Logger Name = org.apache.shiro
Log Level = DEBUG

//
//    Set the ROOT logging level to DEBUG for all engines
//
epadmin --servicename=A.X set logging --loggername=ROOT --level=DEBUG
Engine Name = Pattern_sbapp0
Logger Name = ROOT
Previous Log Level = INFO
New Log Level = DEBUG

Engine Name = System::administration
Logger Name = ROOT
Previous Log Level = INFO
New Log Level = DEBUG

//
//    Load a new log configuration file on all engines
//
epadmin --servicename=A.X --set logging --configuration=new-logging-config.xml
Complete details on the logging target can be found in
epadmin-logging(1).