Navigating to the Application Monitor UI
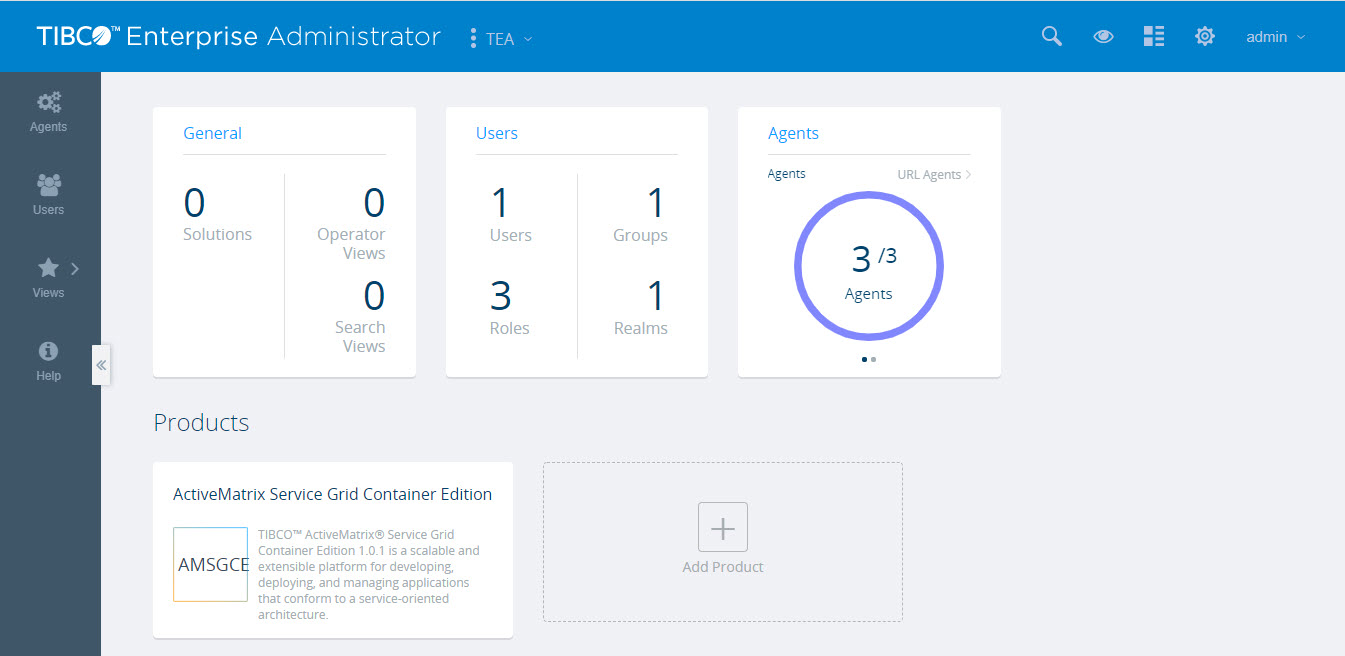
Signing in to the Application Monitor displays the TIBCO Enterprise Administrator landing page. The user name with which you have logged in is shown on the title bar. The landing page displays cards with information about the general details, users, agents, and products exposed to the TIBCO Enterprise Administrator server. All the products (for example, ActiveMatrix Service Grid - Container Edition) exposed to the server are displayed as cards. You can click the links on the cards to drill down to further details.
The following image displays the TIBCO Enterprise Administrator landing page:
Application Monitor Start Page
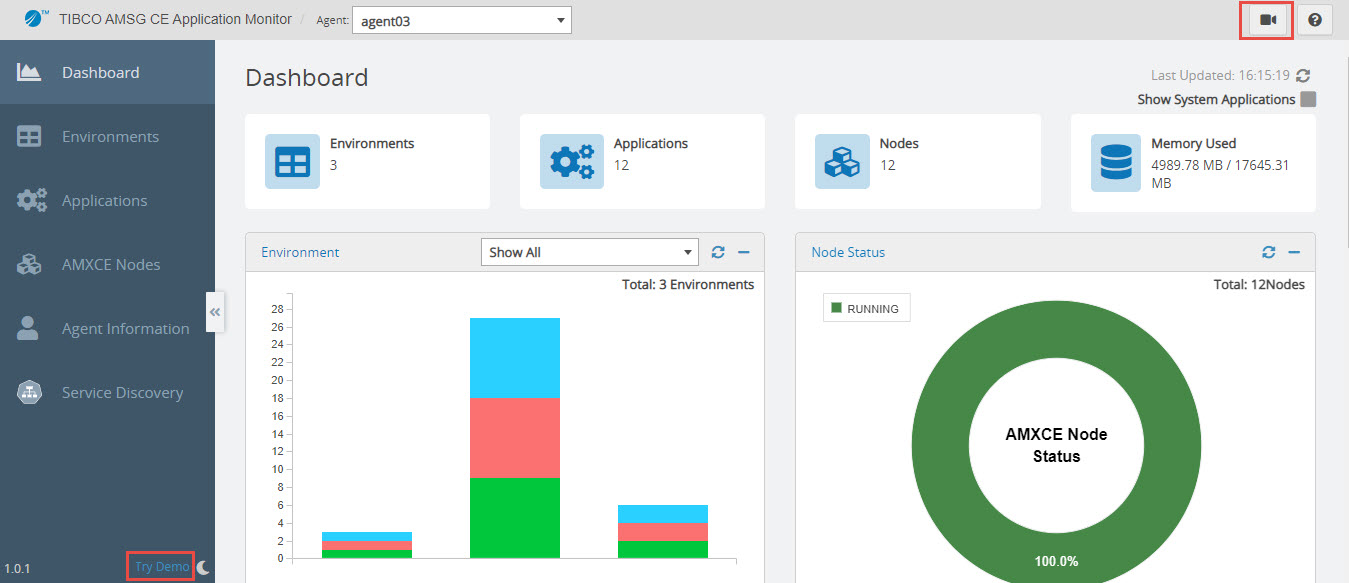
To open the Application Monitor start page, click the ActiveMatrix Service Grid - Container Edition product card on the TIBCO Enterprise Administrator landing page. By default, the Application Monitor opens on the Dashboard page.
The following image displays the Application Monitor start page:
Guided Tour and Demo Mode
To get started, you can take a tour of the Application Monitor UI. To start the tour, click Start Tour  in the upper-right corner of the Dashboard page. You can try the demo of Application Monitor by clicking Try Demo at the bottom of the left sidebar when expanded. The Try Demo button is not displayed on Environments details, AMXCE Node details, and Application details pages.
All data is generated randomly in the demo mode, and dashboard charts are displayed based on the data. Demo Mode tag in the upper-right corner indicates demo mode. All other sessions will display demo data instead of real-time data. You can switch to the real-time mode for the current session by clicking the Close button in the upper-right corner.
Light and Dark Theme
You can switch between light and dark theme by clicking the theme icon  in the lower-left corner.